Carnegie Mellon University (CMU) was ranked number one in 2022 for Artificial Intelligence Programs by U.S. News and World Report. Incorporating CMU’s AI lessons is critical for all industries but particularly those that are historically considered to be “non-technical fields.” Within these fields, the ones who thrive will be those who incorporate at least the lower levels of the stack, namely data management, but an understanding of each layer of the stack will provide industries with a road map to understand how they can increase the efficiency and output of their organization’s business processes.
An Analysis of the Top 50 Webtoons on Webtoon Canvas
Naver Webtoon, introduced in “Hallyu 3.0: The Webtoon Takeover,” is the world’s leading webcomics reading application with over 72 million monthly users. Much like Youtube and Spotify, Webtoon manages a user-generated content platform featuring the works of over 130,000 amateur and professional cartoonists. Comics that are uploaded to Webtoon’s user-generated content section, Webtoon Canvas, and have at least 1,000 subscribers and 40,000 monthly page views earn a 50% share of Webtoon’s advertising revenue. Webtoon offers additional payout opportunities including a creator rewards program and their Original Series publishing program that offers exclusive rights publishing contracts and promotion through the platform. This article returns to the question posed in the previous article: How to content generators incorporate Webtoon into their professional practice and to what measures of success?
The Importance Of Audience Consumption Data In The Entertainment Industry
Since the 1980s, it has been industry practice to measure the number of viewers consuming films and television. These measures affect the industry in multiple ways, from advertising sales to cultivating future viewers, and often contribute to the project’s success. As streaming continues to pivot the entertainment industry, other services will begin to release viewership data in a similar fashion. This crucial step in releasing streaming viewership data has the potential to set a new dawn for streaming services: one where data and transparency lead the way into a more informed and impactful industry.
Streaming Service Algorithms are Biased, Directly Affecting Content Development
Despite the Covid-19 pandemic, 2020 was a big year for the entertainment industry. Many entertainment corporations reevaluated their approach to content distribution and accessibility for viewers. It is increasingly clear that streaming services will continue to exert evolutionary change on the entertainment industry. Regardless of the questions and problems posed about the algorithms used by streaming services, Netflix and other dominant platforms will continue to use them – and continue to work on optimizing the algorithm to eliminate at least the most egregious biases. It is up to the industry to hold itself accountable and ensure that the sanctity of the art of TV and film over the algorithm-based entertainment world.
Part 2: Data Analysis and Visualization Methods for the Arts
After data collection, it is necessary to analyze and visualize the data to tell good stories. This process transforms numbers and descriptions into vivid stories that can be used to prove impact to different stakeholders. This post will look at the best practices for data analysis preparations, quantitative and qualitative data analysis methods, data analysis tools, visualization methods, and data visualization tools.
A Simple Guide to Data Analytics for Nonprofits, Part II
More than a trend or a buzzword, data analytics are here to stay. Newcomers to arts management may find themselves asking, what does data analytics mean for me, and how and why does my organization need to use it? If you are new to arts management, or the data world in general, this two part series is for you!
This article is Part II of a two part series. Part I is available here.
Trends in the Nonprofit Sector
Donors and other major funders typically seek quantitative evidence of mission-related impact in communities therefore nonprofit organizations are making data analytics a standard part practice in daily operations. However, the transition into data-driven decision making hos occurred quite slowly, with over two-thirds of nonprofits reporting that they are only in the beginning stages of implementing data analytics. Furthermore, the majority of nonprofits report that they are not using external data for mission-related analysis; it seems that there is a lack of knowledge or disconnect about how big data can be captured for future community impact. In general, larger nonprofits are more likely to implement data analytics in tandem with improved strategic planning for the mission and programming. Smaller nonprofit organizations, or even arts organizations that wish to place on emphasis on people rather than numbers, have access to many of the same data analytics tools as larger counterparts—so the present concern is why are some organizations not implementing these accessible strategies which can have an immediate impact?
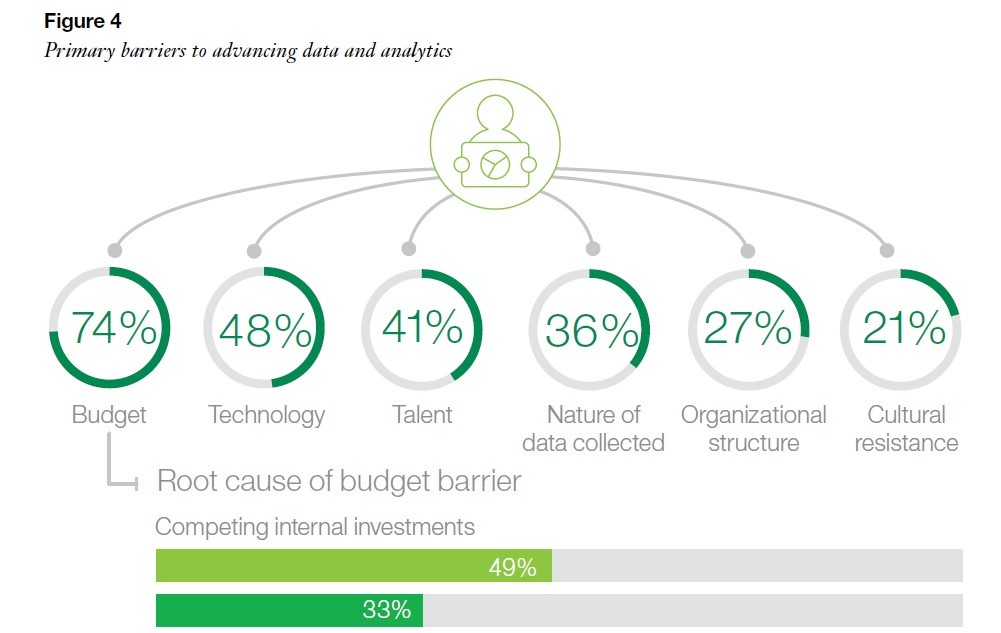
Graph of reasons for not doing data analytic cited by nonprofits: Image credit: IBM, Leap Before You Lag (2017)
Numerous barriers, ranging from internal to external environmental factors, are frequently cited as contributing to an organizations the lack of data analytics use. Particularly for smaller or newly founded organizations, the lack of proper technological infrastructure prohibits even the most basic data analytics collection. Similarly, some organizations cite their limited financial resources. Others are concerned about potential resistance to using data as a primary tool for decision making from major funders and financial decision-makers, such as government supporters and board members. A the perceived lack of expertise within an organization’s staff may also present a barrier.
Some of these challenges may be overcome by training staff in data analytics practices, outsourcing for professional consulting, or creating a staff position specifically for data analysis. Depending on the size and financial status of a nonprofit, each of those options can be a viable solution. Staff can be trained on the more basic analytics tools, and many consulting firms offer services that are specifically tailored to the arts nonprofit sector.
Due to the lack of confidence and informative insight for the implementation of analytics, it is imperative that today’s arts managers initiate a new data-driven operations model in their organizations and make the case to stakeholders. The total digitization of information has created a business environment where institutions cannot maintain long-term success without understanding the importance of data.
Best Practices
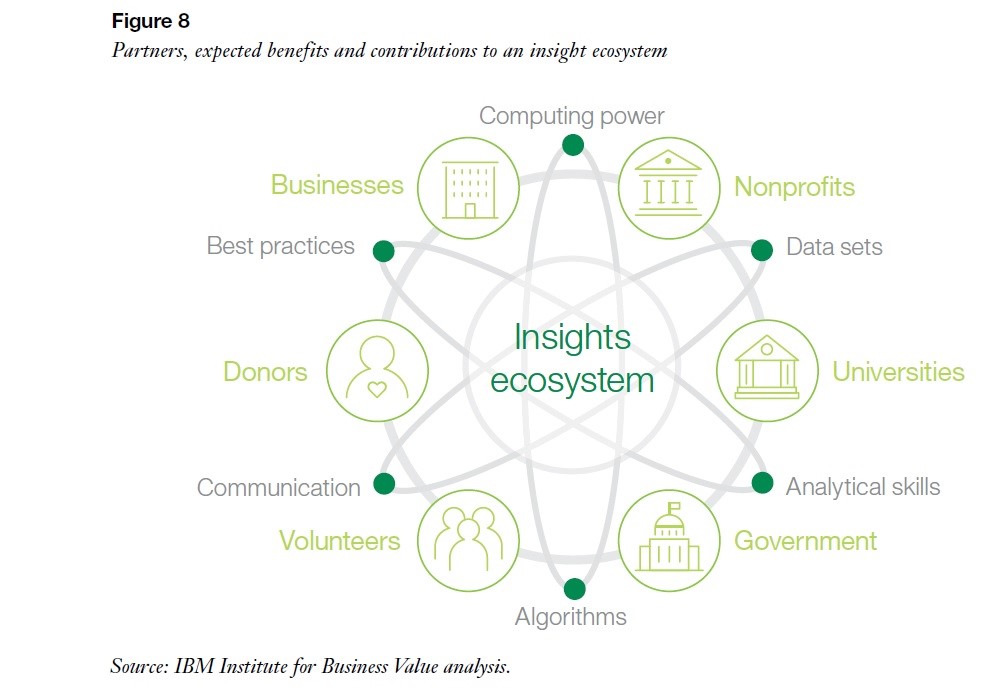
In assessing what type of data to analyze and how to acquire it, arts organizations may benefit from partnering with other nonprofits or seeking assistance from external sources as they begin the journey of analytics-based functioning. As budget constraints are often a prevalent issue, nonprofits may consider a shared data services model and forming an insights ecosystem. This ecosystem is a combination of resources, internal practices, and external information that can help to optimize profitability and mission-focused agendas.
Visualization of an insight ecosystem: Image credit: IBM, Leap Before You Lag (2017)
As demonstrated above, collaboration is actually a key component in the process to becoming a data-driven organization.
A clear strategic plan from a lead staff member concerning the critical nature of data in the arts/nonprofit sector is central to success. There must be a steadfast commitment to using data for major decision-making and a willingness to educate staff and other stakeholders about its benefits. Further, new data practices should align with the financial stipulations set forth by major funders and board members; data analytics must be presented in a way that buttresses the development of mission-based programming for real impact. In terms of internal staff, arts managers need to ensure that “actionable metrics” are defined and the organization invests in the necessary technology to measure said metrics. Data analysis can only be beneficial if the goals are defined and accessible through proper platforms. Consequently, data analytics best practices also require organizational leaders to inform staff of new data-focused operations and empower individuals to improve on their skills in the process. Outsourcing may not be necessary if staff members can be trained on new data software and have the desire to build on their current skillsets. Most important in the data analytics journey is that the emphasis on metrics will build or alter programming in a manner that furthers an arts organization’s mission, vision, and values. The metrics that show evidence of success should be analyzed on an ongoing basis, and should those metrics that show problematic trends should be via immediate changes in budget, programming, staff productivity, or which ever means seems appropriate. Behind all of these best practices lies an individual commitment to seek change; thus, the data analytics truly rests on the “human element” for real-world benefits to be had.
Conclusion
Arts organizations can no longer avoid the use of technology and digitized operational tools in preparing for long-term sustainability. Truly, data analysis is the best method for understanding, evaluating, and changing organizational practices: “Without data, it is impossible to measure financial and operational health, identify problems and measure organizational impact.”The most valuable aspect of data analytics that arts managers should realize is the ability to make relevant organization-wide improvements in alignment with the impact they hope to bring about from their mission statement. While data analysis can effectively aid in the acquisition of donors and retention of key audience segments, nonprofits can use these tools to decide which programming elements are bringing about the community benefits they are seeking (and which are not). Given that an organization’s mission, vision, and values reflect its identity in the community, it would be wise of arts leaders to implement data analytics and become advocates for data-driven decision making.
[1] IBM, “Leap before you lag,” (2017): 1.
[2] Ibid.
[3] Idealware, “The State of Nonprofit Data,” 2.
[4] Ibid., 11.
[5] Ibid., 7.
[6] Ibid., 2.
[7] Ibid., 13.
[8] IBM, “Leap before you lag,” (2017): 14.
[9] Ibid.
[10] Ibid.
[11] Ibid.
[12] Ibid.
[13] Ibid.
[14] Cardinal Path, “The State of Digital Data,” 10.
[15] Idealware, “The State of Nonprofit Data,” 3.
A Simple Guide to Data Analytics for Nonprofits
More than a trend or a buzzword, data analytics is here to stay. Newcomers to arts management may find themselves asking, what does data analytics mean for me, and how and why does my organization need to use it? If you are new to arts management, or the data world in general, this two part series is for you!
New White Paper: Open Data and Data Visualization in Arts Organizations
Data collection and communication is an essential tool for effectively managing arts organizations. Data visualization techniques can reveal organizational or industry insights in a manner which is easy for managers to understand and communicate to their stakeholders. Explore sources for open source data, and low cost, high impact data visualization tools in this new white paper.
Crowdsourced Digital Art Projects: Centralization and Agency
As digital crowdsourced art continues as a mode of art making, it is necessary to developed an understanding of which features of digital arts programming are crucial in the engagement of digital audiences. The following analysis of four digital art projects focuses on the participatory, rather than the interactive, specifically projects wherein audiences become artists by participating in the creation of a piece of art by making one or more creative contributions. Perhaps not surprising, agency and control were identified as significant to participation.
Learning How To Visualize Data: Free & Low Cost Professional Development for Beginners
Big Brother's Sweeter Side
There is an emerging opportunity for collaboration in the cultural heritage sector, as archeologists around the globe call for new methodologies to process mass-information about cultural heritage sites. This article unpacks how satellite imagery and geographical information systems are shifting the structure of the cultural heritage sector.
Pairing Data to Achieve the Most Audience Segmentation Success
Going Beyond Google: Data Sources and Visualization
White Paper Wednesday: Data Practices in the Opera Industry
Big Data, Big Jobs
Data workers are the new must-have for a company. McKinsey Global Institute predicts that in the next three years, there will be a need for 1.5 million data analysts and managers. The Bureau of Labor Statistics lists these careers as one of the fastest growing occupations in all sectors. So from a data analyst to a business analyst to an application analyst to a data scientist, who is who? And with overlapping skills, how can a nonprofit arts organization figure out the difference?
What Leaders Should be Measuring: Six New Metrics from TRG Arts
Between CRM systems, social media management, and Google Analytics, arts organizations today have access to more data than ever before. Indeed, this unprecedented access has allowed for arts leaders to measure their performance more accurately and holistically than in the past. But in this ever expanding sea of data, how does an arts leader decide what information is the most important to focus on extrapolating trends on?
#TBT: The Arts Manager's Toolkit for Data Management
Here at AMT Lab, we have been sorting through plenty of data as we prepare for tomorrow’s release of the full report from our 2015 National Ticketing Survey (stay tuned!). Today’s throwback is a collection of AMT Lab Articles that discuss tools, stories and best practices for the management and usage of quantitative data in an arts organization. Most of these are a more recent throwback, but even those articles from 2012 still provide invaluable resources for organizational leaders.


