Researchers conducted surveys and industry expert interviews to understand current and future consumer demand for AR, VR and Metaverse entertainment options. The survey indicated that consumers were most interested in using AR and VR to enhance experiences in concerts, educational content, and gaming. Respondents also indicated that they were interested in joining the metaverse to participate in social experiences and to attend live music events. The research unveiled generational differences, emerging opportunities, and trends to follow to best meet consumer demands.
Emerging Digital Pathways #3 of 5 Peer-to-Peer Fundraising
Peer-2-Peer (P2P) campaigns are used often among the non-arts nonprofit community in the United States. 87% of Millennials and Generation Xers are willing to use peer-to-peer for their giving. P2P is a digital fundraising platform that strengthens the relationship between donors and arts organizations. It is an interactive platform where donors can be more actively engaged with their organizations and share their contributions with their peers. If arts organizations want to build deeper relationships with donors, they should try to include P2P in their fundraising plan. The following article explains how.
Let Your Voice Be Heard! 2018 AMT Lab Reader's Poll
How Do You Compare in Digital Fundraising?
AMT Lab is researching emerging digital fundraising tools so that arts organizations can, hopefully, take a bigger part of the 14% increase in online giving. With $380 billion dollars of giving in the USA in 2017 and more people than ever giving online, the future of fundraising is changing before us. And don't be fooled -- the majority of the online donors were older than 49 years old. To understand how the arts can maximize current and emerging fundraising opportunities, a benchmark of what is happening in the field today is underway.
What's Next? 2016 AMT Lab Reader's Poll
What Motivates YOUR Audience?
Earlier this year the NEA expanded its analysis of the 2012 Survey of Public Participation in the field to better understand the drivers behind various types of participation, from attendance to art-making. This study, entitled "When the Going Gets Tough," not only provides insight into what barriers affect different types of audiences, but also reveals that there is a significant core group of "interested non-attendees."
SecondSundaySurvey: Trends in Digital Video Consumption
More and more arts organizations are investing in digital video production as a means of engaging audiences who want to know more about arts programming. These audiences connect across a spectrum of devices, so knowing how audiences consume video will help organizations create the best format for engagement. A new survey conducted by Ooyala illuminates these patterns and provides vital insight to the conversation surrounding video distribution.
Tell us how you really feel - AMT Lab 2015 Reader Poll
Hello AMT Lab Readers!
With another year of research, reviews, interviews, and more almost completed, we wanted to take a moment to ask about your needs and about what content you'd like to see more of in the future. Please consider taking a moment to complete our 2015 Reader Poll, either below or on the home page so we can better serve your needs.
The Dynamic Box Office
Airlines have been doing it for years. Ticketmaster (in its latest incarnation) recently jumped on the bandwagon.
Dynamic or variable ticket pricing is the strategy of altering ticket prices based on different variables. (As noted in the comments below, "Variable pricing is setting BASE prices according to differences in performances' time of day, day of week, etc as in paragraph 2 (a midweek evening may be less expensive than a Sunday matinee, for instance). Dynamic pricing, on the other hand, changes prices after the initial on-sale in response to changes in demand over the sales cycle." I use the term "dynamic pricing" in this article to discuss changes made to prices once the tickets have already gone on sale, altering FROM the base price. Thank you for pointing this out, Kara!) These can include everything from the number of seats already sold at the time of purchase, the proximity of the show date, alternative entertainment options on the show date, anticipated weather, and any number of factors that the host deems as having an impact on ticket prices. It is perhaps a more realistic and “fair” way to price tickets, allowing the cost of tickets to reflect the actual supply and demand of the market. This should result in minimized dead-weight loss, which benefits but the consumer and the supplier. For performing arts organizations, grappling with decreasing advance-ticket sales and discounting options that gouge profit margins, dynamic pricing might be “just the ticket.”
Unlike regular discounting or promotional pricing, the dynamic ticket model would enable organizations to price each production—and even each performance--strategically and, perhaps, more realistically. Instead of offering incentive discounts, both the organization and the audience would be able to gauge expectations for a show based on the ticket prices. Declining ticket sales and decreased subscription renewals lead marketers to worry and wonder about the most effective way to promote ticket sales. A common “solution” is discounting, which leads to a host of other problems. Ron wrote this piece for Group of Minds outlining what the major drawbacks to discounting. Rather than reiterate what he has already presented so well, I will simply say that I agree with his concerns about this eagerness to discount in order to get butts in seats. Considering these issues may make dynamic pricing a more attractive option for some.
A great example of the potential for dynamic ticketing is its recent use outside of the airline industry-- the newest Ticketmaster/LiveNation partnership is exploring the efficacy of dynamic pricing for sporting events. Last year, an article in Sports Business Journal did a great job outlining the way that dynamic pricing works at the San Francisco Giants’ AT&T Park.
There are a couple of key sentences in this article that I wish to address as they pertain to the performing arts industry:
- “Advanced software analyzes market conditions and determines a pricing recommendation that team executives can either accept, deny outright or tweak.” That’s the kicker: advanced software. I know that the biggest question is always: how can my organization do this? Non-profit performing arts organizations already face challenges being short on staff; the responsibility and complication of daily ticket price changes could be a full-time job in and of itself.
Analyzing the results of the 2011 Ticketing Software Satisfaction Survey, most respondents indicate that box office systems are either custom-built, cobbled together, or some of the solid, inexpensive options available to organizations. I went through and sent inquiries to the organizations listed in Amelia’s overview of the ticketing software survey results, as well as some others that respondents are using.
Unfortunately, at this time, nobody seems to have an easy-to-use “dynamic!” function in their software that makes it easy for an organization to alter prices without sending an actual staff member in to change them by hand each day. But the conversation is building in volume, and a few companies expressed that they can either design such a component for their clients, are looking into offering dynamic pricing in the future, or would like to know more about the demand for this function before they pursue including it in their products. (Just before posting this, I received the following from ProVenue: “We have no dynamic pricing customers in the UK as yet, however we do in the US. Please click on (this link) for details. We are looking to release in the UK sometime in the new year.” (I learned that ProVenue is part of the company that provides this model to the Giants. How accessible this component is for budgets that may be more modest than those of the Giants, however, is a question that I have yet to get a response to.)
- “(S)hould a game get rained out, standard refund and exchange policies would apply. But if a fan pays a premium price to see a particular player, such as a starting pitcher, and that player doesn’t play, there is no refund.” This quotation makes me smile, because in the performing arts, understudies are just part of the game. It does beg the question, however: what if someone paid a price bump because of a certain headliner, and that artist’s understudy performs that night? Does the ticketholder get a refund of the difference? We are all familiar with understudies and what that can mean.
- Perhaps the most universally applicable part of this article is the section “What’s the payoff?” As it outlines, “Dynamic pricing structures can provide significant cost savings for fans over original list prices for lower-demand games, and for teams, provide another means to help fill seats, generate additional concession revenue and potentially upsell that fan into a larger, future purchase. And for higher-demand games, dynamic pricing provides teams a revenue maximization tool to capitalize better on that heightened fan interest.” So actually, dynamic pricing could give us in the performing arts a real understanding of how our work is valued. We make a lot of guesses, some educated, some not, to try and figure out what the “best” price is for the work that we produce. Could dynamic pricing remove some of the mystery, and help us maximize both the number of tickets sold and the revenue generated?
Some may balk at the idea, as Diane Ragsdale does in this article on dynamic pricing in the non-profit sector. She quips, “Let’s call a spade a spade. Dynamic pricing is a method for maximizing profits….Suddenly increasing ticket prices in response to high demand, and selling ‘premium’ seats priced as high as people are willing to pay, strike me as questionable practices in a nonprofit organization.” What will it take for people to stop associating “non-profit” with “NO profit”? She likens dynamic pricing in the non-profit performing arts sector to soup kitchens charging for certain perks. What an unfortunate and offensive comparison. Non-profit arts organizations are businesses, regardless of their tax status or their primary sources of funding, and selling tickets is a fundamental component of what they do. Certainly, there are organizations whose missions might preclude them from dynamically pricing their tickets (e.g. “free art for all”), but there are others for which dynamic pricing could help generate more revenue (not a bad thing) and bring in more audience. As Lori Kleinerman of the Goodman Theatre remarks in her compelling talk on the Goodman’s use of variable and dynamic pricing, “We are aware of our civic responsibilities as a not-for-profit institution, so it’s important that we are accessible while still optimizing our income.”
There are many ways to apply dynamic pricing within the performing arts sector, and with more use some things may become evident. It is possible that it is a practice best suited for venues that do not scale their houses, or best applied to the “nose-bleed” sections, or only effective for the blockbuster shows. Of course, the key word there is “possible.” As we lament the decline of ticket sales, the loss of revenue when we discount with programs like Groupon and LivingSocial, and the oh-so-onerous epidemic of last-minute-ticket-buyers, why not consider dynamic pricing as an alternative model for revenue generation? After all, we may be “non-profits,” but that doesn’t mean that we aren’t subject to the supply and demand curves that drive for-profit business economics.
New Questionnaire: Living Social, Groupon and the Arts
The Living Social, Groupon and the Arts Questionnaire is now live!
Has your organization offered deals through group discount sites like Groupon and Living Social? Have you ever wondered about how other arts organizations are using online group discount services, and the successes and challenges they've faced along the way?
We were wondering, too. So, we put together a short questionnaire to find out.
Please take a moment to fill out the Living Social, Groupon and the Arts Questionnaire and let us know about your own experience with either of these sites. It will only take a few minutes and your answers will remain anonymous, unless you specifically tell us otherwise. The questionnaire closes on April 15, so click through and fill it out before you forget!
And as always, we'll share the results with all of you here on the blog. Fill out the questionnaire today!
How do you share your season brochure with your website visitors?
Amelia is working on a follow-up to her article from last year on the London Symphony Orchestra's use of their interactive, online season brochure. While her follow-up will focus on the success and challenges that the LSO faced with this pursuit, we wanted to check in with our readers to see how you are sharing your season brochure information with your online visitors. Please, take a moment to respond to the following poll:
Help Us Help You
Last year around this time, we launched our Technology in the Arts webinar series. To keep this service relevant to the needs of our online community in the coming year, please share with us the topics and types of webinars you would like for us to offer. Type your ideas directly into the box below and click on "Finish Survey" - it's that easy. Thank you in advance for your thoughtful responses!
Audience 2.0, Part II: Thoughts for the Future
Check out Part I for an overview of the NEA’s recent report Audience 2.0: How Technology Influences Arts Participation While Audience 2.0 gives some useful statistics on technology and media participation in the arts, the report does not provide the answers or the data that I am looking for regarding arts participation and technology.
- How does arts participation through one technology affect participation in other technologies? For example, how does participating through television affect web participation?
- What impact has social media had on arts participation?
- How do people participate in the arts digitally and online? What are they doing on the web when they are participating?
- Has participation in the arts via technology affected online giving to arts organizations?
Audience 2.0 draws into question the timeliness of national arts research, the vehicle being used to conduct this research, and the understanding of where arts audiences are heading in the future. This report was a useful audience analysis for 2008, but the survey upon which Audience 2.0 bases its analysis lacked a sense of forward motion as well as the ability to predict future arts participation through rapidly changing technologies.
The data used in Audience 2.0 was gathered three years ago before many current technologies were available and before many new technology users had invaded the digital market. In his blog post Back To The Future, on Danceusa.org, Marc Kirshner states that:
Since the beginning of the 2007 survey period [for the 2008 report]:
- Four generations of iPhones have been released [and the Android network has been launched]
- Facebook’s user base has grown from 20 million to 400 million users
- The entire book publishing industry has been turned upside down by e-readers, such as the Kindle, Nook and iPad
- Millions of set-top boxes, Blu-ray DVD and home theater PCs have connected televisions to broadband Internet
- Hulu launched its online video service to the public
- More than 300,000 people viewed simulcasts and encores of the Metropolitan Opera’s Carmen
- The first 3-D network began broadcasting
The three year time gap between data collection and report publication created a lack of focus on many forms of new media and social networking platforms currently leading many technology discussions in the nonprofit arts industry today. Correspondingly, the relevance of the report in our current environment is brought into question, and we must remember that the report represents a snapshot in time more than a study of current habits. Due to the speed with which technology advances and its usage changes, traditional forms of data collection and publication no longer appear as useful for tracking these trends.
The survey asks about participation in the arts through technology, but Audience 2.0 does not provide answers about specific actions and their effects. The survey does not ask participants if electronic and digital media makes them more or less likely to attend a live event, but the report draws based upon a perceived correlation in the participation data. Without causality data, this correlation leaves us with a “chicken or the egg” dilemma. Does electronic/digital/online participation in the arts lead to an increase in live participation, or are participants in live arts events simply more likely to participate in electronic/digital/online arts events?
I would like to see more direct questions being asked of people who responded that they participated in the arts through electronic and digital media. Obtaining this next level of understanding will provide us with a deeper understanding of the effects of electronic and digital media on arts participation.
Audience 2.0 raises more questions than it provides answers, but it does show a commitment on the federal level to assess the impact of technology on the arts. I am hopeful that future reports will delve deeper into the seemingly symbiotic relationship between technology and arts participation by focusing more specifically on the digital/online arts participant.
When They Don't Notice: The Implications of Omitting the Arts from General Interests
Tom H.C. Anderson of Anderson Analytics was kind enough to respond to my request to speak to him regarding his company's survey on social media demographics. This was the survey that suggested that the arts are not important to social media users. 
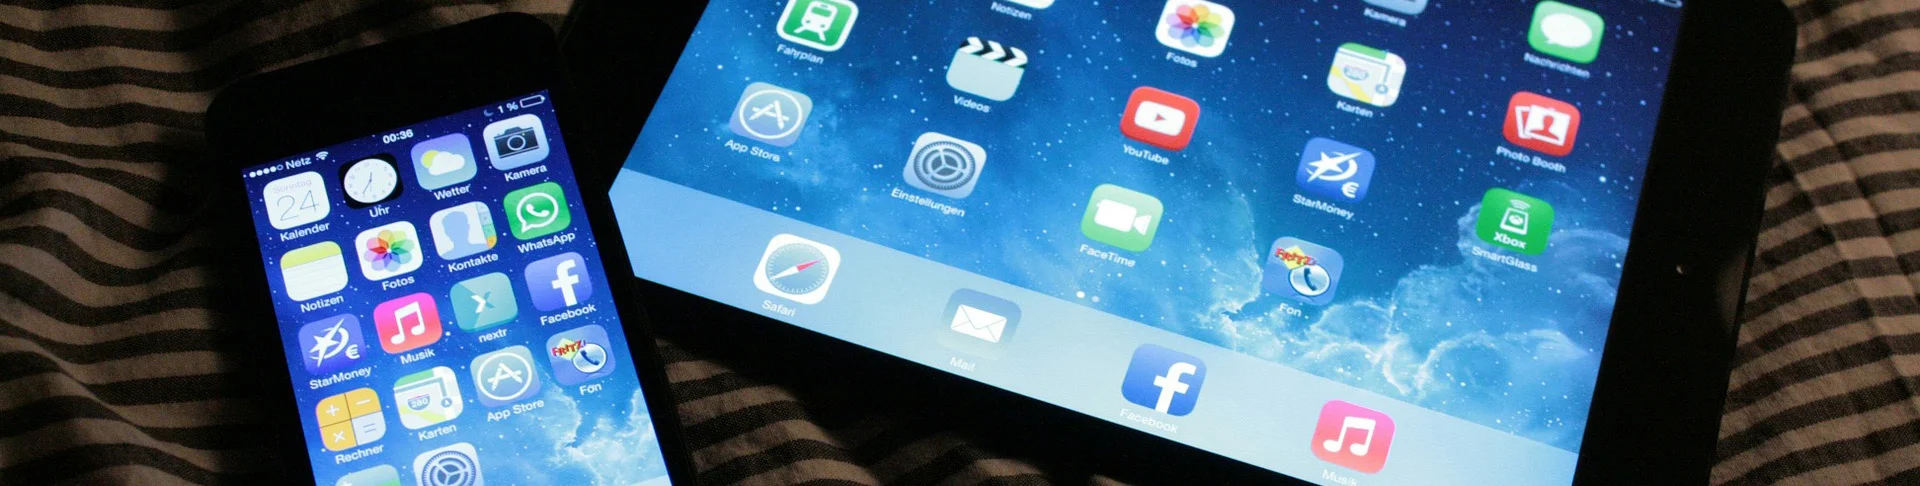
We talked for a while, and Anderson was helpful and informative. On some level the information that he provided was a comfort, but ultimately it left me upset. It is not the survey's conclusions that imply that "social media users just don't care about the arts." It was the survey's very design which indicates that the arts aren't considered among the things that people might find interesting. Anderson explained that the respondents on the survey were online panelists who signed up to take the survey. 1,000 individuals were surveyed every month for eleven months, and then 5,000 were surveyed in May, prior to the data analysis and subsequent release. Respondents were aged 13 and up. The survey was designed to assist all Anderson Analytics clients (i.e. for-profit, commercial businesses) in target marketing via social media, and used past client-specific surveys as a loose template.
The survey was divided into three categories, each of which asked respondents to rate activities and interests based on how much time these individuals spend investigating them online.
Initially my reaction was "Great! This does not mean that these people are UNINTERESTED in the arts, but they may not consider the web as the best way to get their information." Personally, I would rate my interest in theater as quite high, but if I were to consider how "much time I investigate it online," that rating would be much lower.
Then I thought, ok, well let's look at how the arts were presented to these respondents, and see what specific interests they were rating.
Here is the extent to which art of any kind made it onto the survey. Under the heading "Hobbies" were the choices Photography and Arts and Crafts. Under the heading "Entertainment" were Music, Movies, TV and Theater/Concerts.
...And that's it.
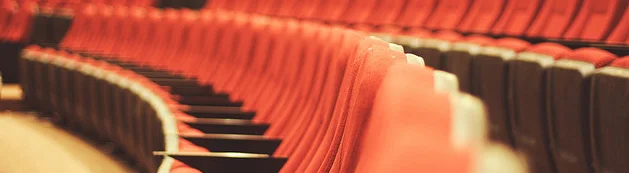
Okay, ignore, for a moment, the upsetting fact that Theater is considered equivalent to Concerts or that Photography is only considered a "Hobby."
Where is Dance or Opera or the Symphony or Museums or Galleries or Painting...just to name a few?
Not to mention that lumping Theater and Concerts together is as absurd as if Anderson Analytics had combined, under "Health and Wellness," the headings Golf and Spa or Sex (yes, a choice on the survey) and Tennis. I doubt that Golf and Spa would ever be a category on such a survey--because people "get" that they could love golf while not being a big spa fan. Apparently, it is not so obvious that I might attend a theatrical production on a weekly basis despite not having seen a live musical concert since April of 2008. Does that mean that I have to take an average of the two "interest" levels? And if I don't, my interest in Concerts is going to rate falsely high. (As a side note, 21% of Twitter users expressed interest in Theater/Concerts compared to 16% of LinkedIn, 15% of MySpace, and 14% of Facebook users.)
It is important to bear in mind that the purpose of the survey was to benefit Anderson Analytic clients (who include Unilever and Intercontinental Hotels Group) by identifying the demographics of specific social media sites. Knowing that LinkedIn users tend to be older, have more money, and like online poker, and that bloggers and coffee-drinkers tend toward Twitter, means companies can tailor their advertising and promotional placement to best target their potential customers.
As we spoke, Anderson unintentionally summed up the most unsettling implication of the survey when he remarked that, if a certain site is most used by 18-year-olds and young adults (who have their own interests), that site isn't a great place to advertise theater. Additionally, if you want to market an opera you should use LinkedIn because the demographic is older and wealthier on average.
There it is, folks. The arts are for the older and richer. THIS is the perception (or reality) that we have to change. While yes, we absolutely need to have a better grasp on who is using social media in order to identify our target demographic and generate the best ROI, ultimately we really need to change the too-often-held belief that arts are so esoteric they doesn't count as an "interest" of the general public (unlike golf...or entertaining...or travel). Why wouldn't a hotel group want to know what level of interest potential clients have in local performances? Or whether it would be worthwhile to establish a gallery space in the hotel?
So, organizations, artists: social media isn't going to magically make audiences out of people who don't care about what we do. Doing the same thing on a different platform doesn't make the people who weren't listening before suddenly perk up and get excited.
On every level we must engage younger audiences, or generate interest in our work from the sex-having golf-playing movie-going tv-watchers. We can't force them to come to us, but we can't keep burying our heads in the sand. Let's RECOGNIZE this challenge, and be realistic about it. Things won't change overnight; but we must whittle away at the overarching lack of interest in who we are and misinformation about who we serve. The arts are for everyone. But it only counts when EVERYONE knows that.
Home Page Call To Action Survey
Though it might be debatable, it's a commonly held belief that the home page is the most important page of a Web site. A home page must quickly communicate the soul of an organization to a visitor and provide a visitor with easy access to relevant information. Often, it is the most vital and heavily trafficked piece of real estate on your organization's Web site. We recently wondered: how effectively are performing arts organizations in the field using their home pages?
We conducted a survey that examined three common calls to action that we believe all performing arts organizations should have prominently placed on their home page:
- ordering and purchasing tickets
- donating or contributing money
- joining or subscribing to a mailing list or newsletter
These are three actions that most performing arts organizations want their Web site visitors to be easily take. So, just how easy are their home pages making it?
We were also curious to see how many organizations were still using splash (Flash introductions or animations, slide shows, etc.) or landing pages that delay the visitor from getting to the actual home page.
Click past the jump for more information on how we conducted the survey and for the results.
Methodology In all, we looked at 450 home pages of performing arts organizations across the United States. All 50 states and the District of Columbia were represented. There was a mix of dance, theatre, musical theatre, opera, symphony, and choral companies.
We asked two different people to review each home page for links or areas relevant to the three calls to action described above. They then scored each call to action using a scale of 0 - 5:
0 - Not on home page 1 - Hardly noticeable 2 - Somewhat noticeable 3 - Noticeable 4 - Very noticeable 5 - Immediately noticeable
We also asked reviewers if there was a splash or landing page prior to the home page. Finally, we gave the reviewers an opportunity to provide any general comments or thoughts on the home page and its design.
The Reviewers We used workers on Amazon.com's Mechanical Turk service to perform the reviews. 44 unique workers participated in the survey responses. At least two unique workers reviewed each home page.
I'll be talking about our experience with Mechanical Turk in a later blog post. To summarize, Mechanical Turk is a service that allows you to set up and pay workers for completing repetitive, simple tasks, such as a survey, that can be accomplished by a human computer operator.
Because of this crowd-sourcing approach, we manually reviewed the resulting data. We investigated and eliminated some data points due to inaccuracy or due to large discrepancies between to the two individual reviews for a home page. Ultimately, we ended up with valid reviews for 429 of our 450 home pages.
Results The detailed results are below. I was surprised at how well performing arts organizations are doing at making tickets available online. The results are quite strong in that area. The fact that 4.9% of organizations still have splash pages makes me cringe a bit, since I am completely against them. (Why make your users work harder to get to the information they care about?)
Another area where the results surprised me was the reviewer comments. The comments were optional and required that the reviewers spend some additional time to complete their response; given the nature of working as an Amazon Mechanical Turk, time equals money. Some of the comments were really in depth and revealing. This might be a reflection on the quality of the Mechanical Turk service, but it could also be due to the reviewers being excited about contributing and giving feedback to performing arts organizations.
If anyone has any questions about the results or would like any additional information about the methodology used in this survey, please post a comment.
Download Raw Call To Action Survey Data (CSV)
Overview | |
# of Home Pages Reviewed | 429 |
Splash Page | |
% of Sites with Splash Page | 4.90% |
Ordering and Purchasing Tickets | |
Average Score | 3.0 |
% of Home Pages with a Score of 0 | 16.8% |
Donating or Contributing Money | |
Average Score | 2.5 |
% of Home Pages with a Score of 0 | 21.9% |
Joining or Subscribing to a Mailing List or Newsletter | |
Average Score | 1.6 |
% of Home Pages with a Score of 0 | 38.7% |
Reviewer Comments | |
% of Reviews with a Reviewer Comment | 36.60% |
% of Comments that were Positive or Neutral | 54.1% |
% of Comments that were Negative | 45.9% |