


AMT Lab Contributor Kate Martin joins the conversation around The Metropolitan Museum of Art's new logo. What lessons can arts managers learn from the way the Met went about this rebranding initiative?

This month, music and film are at the forefront as each battles with the future uses for burgeoning tech. While AI-generated film visuals seem to be coming up short, progress toward realistic AI-generated music is starting to send shockwaves. On the consumer side, music streaming tools are being released to allow more listening experience customization. Across the industry, artists are celebrating ways that some these new tools can enhance their work, while speaking out against potential impacts on jobs, compensation, and creative freedom.
Generative AI (GenAI) has become increasingly integrated into marketing and communication careers, and even our daily lives, with the rise of various text-to-image, text-to-video, & text-to-text tools. As digital marketers find new and innovative ways to keep up with the trends, and specifically GenZ in a quick-changing popular culture scene, how are they reacting to the rise of GenAI?
Arts and cultural organizations are becoming increasingly aware of their climate impact, and many are taking action to reduce harm. Tracking, reporting, and offsetting emissions may seem like an overwhelming feat for small or mid-sized organizations, but emerging blockchain technology may help make the process more efficient and reliable.
As previously foreshadowed by Samantha in an article written in July of 2023, TikTok: Opportunity and Risk, TikTok has been under a microscope from governments across the globe for quite awhile. The analysis provided in her article is still relevant today given the recent vote to ban TikTok, and the United States House moving forward to force Chinese state-owned TikTok company ByteDance to sell their ownership of the U.S. version of TikTok, or lose access to the United States TikTok market. To fully understand the situation, this article will recap TikTok’s controversial Privacy Policy and the 2023 testimonies, and also discuss the current governmental situation surrounding the ban.
Digital strategy has become a buzzword after the explosion of AI in the last 18 months. Yet, it is not about AI. AI has been the tipping point for organizations and professionals to recognize that they must update or create a digital strategy for success. Digitally-forward arts organizations already have a digital component as part of their strategic plan. Read more to understand the need for technology to be a core component of strategic plans and operations.
How are marketing departments at large American Opera institutions using their data? This new Whitepaper by AMT-Lab Contributor Kevin O'Hora uses four case studies to paint a picture of how companies are using data acquired by their website. Full of insights for marketing departments across disciplines, this publication includes software recommendations as well as general strategies and best practices applicable to any arts marketer.
Are you curious about beacon technology? Perhaps you're wondering how you should go about choosing a beacon hardware provider. Or maybe you are considering how you would use this technology in your performing arts organization. AMT Lab Contributor Kate Martin has created an infographic to get you started answering these questions.
For years we have heard about the decline of subscription sales and revenue across the arts. TCG’s Theatre Facts 2014, for example, showed how “both single ticket and subscription sales were at a 5-year low in 2014.” Subscriptions specifically declined by 6%. However, according to a new study commissioned by the League of American Orchestras and conducted by the Oliver Wyman consulting firm, perhaps the issue is not subscriptions themselves, but the manner in which we have traditionally packaged and sold them.
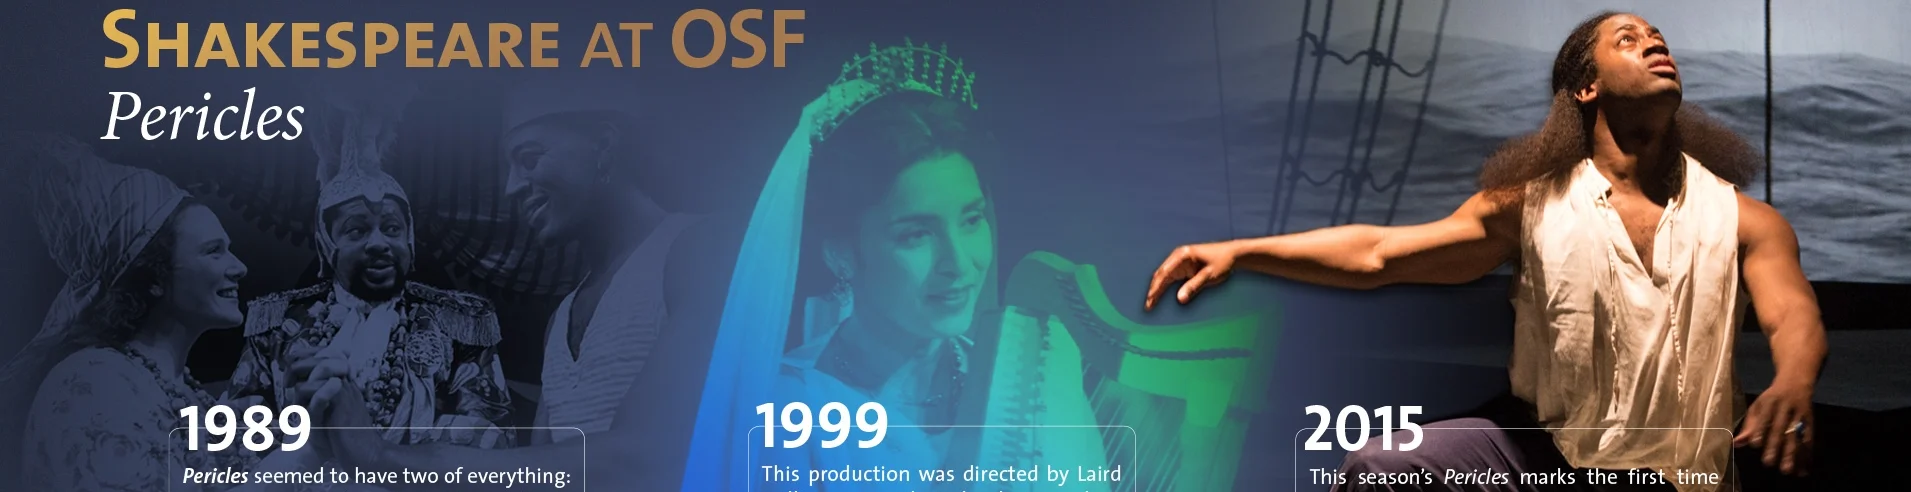
Guest Correspondent Randolph Jones of the Oregon Shakespeare Festival attended Capacity Interactive's 2015 Digital Marketing and left elated and hopeful. The conference focused on the intersection of technology, marketing, and the arts and featured presenters from across the sector. To learn more about what these presenters had to say, and to see what insight Jones draws himself, read the full article here.
Whether working in digital or traditional channels, quantifying impact and engagement is a challenge. Often, it is difficult to find the causal link between marketing efforts and programmatic success. It can also be confusing to figure out how to effectively use Google Analytics, which, when mastered, can be used as a tool to identify successful communication strategies and observe user behavior.
Our latest publication, From Strategy to Analysis: A Guide to Navigating Google Analytics, gives arts managers a potential solution. Drawing parallels to the scientific method, this paper gives a complete step-by-step process using a theoretical case study organization to illustrate how an arts manager can use Google Analytics to achieve their organizational goals.
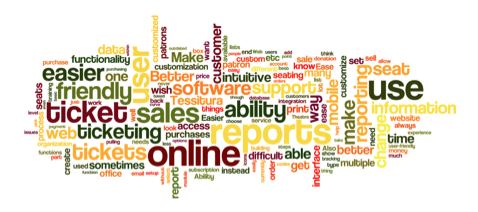
The AMT Lab researchers and editorial staff are proud to announce the release of the 2015 Ticketing Software Survey. After 3 surveys across 6 years, the research team is happy to announce that ticketing software systems are meeting most of the needs faced by arts institutions. Yet there are significant differences in feature use and perceived importance when analyzed across budget size, geographic area or discipline. In addition to deep analysis of the data, the report includes an appendix of every question and the raw data. Vendors and institutions will find this report useful for future decision-making and grant writing.
Contributors Aoni Wang and Giorgia Gandolfini recently attended Idealware’s webinar, Infographics for Outreach, Advocacy, and Marketing: From Data to Design . This talk delved deeply into strategies for successful design of infographics.
Per Idealware, an infographic is an image that presents data, transferring numbers into a comprehensive visual narrative. Infographics have become very popular among organizations, as they are generally easier to understand and more effective at communicating data to the population at-large than traditional spreadsheets and reports. Infographics attract attention and provide new ways for visitors to engage with data.
This article is cross-posted on the blog Analysis from TRG Arts.
Read the first post in this two-post series here.
Last month, I wrote about the overwhelming amount of data produced by the sophisticated database systems now common in the arts industry. My commentary on the “analysis paralysis” that can result caught the attention of many of our readers. We’re glad, because 20 years of consulting work has taught us this: data-driven hard work works.