Welcome to the fifth installment of the Social Media Spotlight, our monthly feature focusing on arts organizations’ social media strategies.
How to allocate time and money towards both social media engagement and online marketing is different for every arts organization. To get a different perspective Technology in the Arts decided to talk with a smaller organization, the ToonSeum, about how they achieve their social media and online marketing goals with a limited staff. I had a chance to chat with Joe Wos, Executive Director of the ToonSeum, about his approach:

So Joe, what is the ToonSeum?
The ToonSeum is Pittsburgh’s Museum of Cartoon Art. It is one of only three museums in the country dedicated to the cartoon and comic arts. We offer rotating exhibitions covering all aspects of cartoons and comics, from animation and anime, to comic strips, comic books, editorial cartoons, illustration and much more. We also offer ongoing workshops, screenings and lectures.
It really is one of the most unique museums in Pittsburgh. Every city may have a version of a children’s museum or traditional art museum, but there are only three cartoon art museums! New York, San Francisco and Pittsburgh. We take great pride in our unique place in Pittsburgh.
What kind of marketing and PR challenges does the ToonSeum face?
Our number one challenge as with any small non-profit is budget. We are a small museum up against juggernauts! We are up to the challenge. If anything, budget limitations have led to creative thinking. You aren’t going to see us investing a lot in “traditional” advertising. Being a smaller museum also eliminates a lot of the fear of change you see from larger venues. We don’t have a huge investment in outmoded technology or ideas, so we are more inclined to let go and move forward to embrace new ideas in both marketing and tech.
We have been very lucky, the media both locally and nationally has been very supportive. Part of that attention is because of our approach to marketing. We use online marketing to create interest in “real world” experiences. We innovate new ways of reaching out. How many museums can say they had their own beer? Illustration Ale was a great success. We didn’t mail out postcards we used facebook.
In February we will launch our own themed hotel room in partnership with the Wyndham Grande downtown. It’s all about immersive experiences, translating virtual experiences we enjoy in gaming and through cartoons into the real world. That’s the kind of creative thinking we embrace.
A limited budget forces truly creative thinking.
Why did you choose to go with social networks/online marketing as a solution?
We are a fan-based museum. It’s a new approach to museum management, marketing and even exhibitions. Comic and cartoons by their very nature, are a fan-based medium. We embrace that. Just look at San Diego Comic Con, why is every major movie launching there? Because of the power fans have via social networks. We tap into those same fans. We are a geek museum, and proud of it. Our audience is very tech savvy, early adopters who can market virally better than anyone.
We know that the ToonSeum is a real world extension of a fan based virtual world. We are a museum of characters, icons and avatars. We want to become a real hub for comic and cartoon fans, and the only way to do that now, is through creating online connections and then inviting them to join us at the ToonSeum. Once we get them here, we know, they will tell their friends, strangers, tweet, blog, post, and tell the world about us.
We also recognize that it can’t be just virtual, you have to take it to the fans! We have booths at major Comic Cons, from San Diego to New York. We also host Blogger events and Tweet Parties at the ToonSeum. If we can get the word out to them about our exhibits and programs they will help us spread the word.
Beyond the standard social media efforts, such as a Facebook page and a twitter account, what other types of online efforts are the ToonSeum trying?
I worked for twenty years with a museum that had a real aversion to technology, it took a decade for them to come around. The ToonSeum is the opposite. We want to be the first. We were the first museum in Pittsburgh to have an I-Phone App. We may still be the only one! MailChimp, EventBrite, every new social marketing tool that comes out we give it a try. We were among the first to participate in KickStarter (we were even featured in the New York Times in an article about it.) I attend the Consumer Electronic Show in Las Vegas just because I know we need to stay at pace with the public. The technology in most museums is outdated, kids can do more advance and exciting interactions at home. So we reach out, we are a Beta Test museum. We put ourselves out there to new technology and say, let us try this out first!

We have an ipad docent at the entrance. Any guests who wants to experience more online while in the gallery can use it as a tool.
For light up night we launched lights in our windows that can be controlled from the outside via an iphone. The guest has control over their experience before they even enter the door.
I am a self-professed geek and nerd, I attend the Consumer Electronic Show in Vegas every other year, I attend the Toy Fair in New York. I bring those innovations and ideas back to the ToonSeum and find ways to integrate them. So the ToonSeum has a giant screen projection in the center of our ceiling that loops cartoons. It is of course blu-ray 3d as well.
We have worked with Behar-Fingal to integrate QR codes into all our exhibitions. This allows guest with smartphones to link to additional content online. Whether it is a wikipage entry on the artists, or video we provide of the cartoonist at work. This is a great tool to take our exhibits beyond our walls and is also cost effective. People are walking around with access to all the information they need. In the future museums won’t need placard after placard of explanatory text. They will just need to provide a link. Their curiosity will take them beyond your walls. Each and every work of art is a potential jumping off point to a world of discovery in the world wide virtual museum.
We know that the traffic has to flow in both directions. A museum should be a destination from those on the web looking for real world experiences, but a museum must also be a gateway to curiosity that can be infinitely explored in new and exciting ways online.
Despite our using technology in so many ways, the ToonSeum is still ultimately about art on the walls. Because we have integrated ways to put the technology in your hands we don’t have to use a lot of monitors and computers. It makes it an individual experience, which is something we learned from social marketing. Everyone wants to interact on their own terms.
I know you operate on a small staff, how does this affect how you manage your various online efforts?
We have a social marketing intern whose only job is to tweet and post. That’s a must! The museum has to have a presence online that allows for immediate interaction. So we respond to every tweet that mentions us, every facebook post. It’s time consuming but it is the most important aspect of social marketing… being social!
All of our staff also has access to post to our various accounts. So we are updating daily. More important though is the fact that our fans are out there, retweeting and posting everything for us. It gives us a much bigger presence.
They also know to speak with the ToonSeums voice. It’s always connected to our mission and not personal. I have seen top-notch museums whose official facebook page has post about their kids getting the flu! Unless there is an epidemic of every kid visiting your venue getting the flu, how does a museum have kids that get sick? It doesn’t. Your venue has to have a virtual identity, a voice that your fans can interact with and it has to be consistent.
This is all easier to accomplish with a small staff. There are no committees, no approval process, no budget meeting, we identify what needs done and do it!
Does your staff size affect how you track the success of all of your online projects?
Every guest that comes in is asked how they heard about us, and their zipcode. We track every single opened email and clicked link. That data is all placed into a matrix we use to measure our success. It doesn’t take a big marketing firm, it just takes a commitment of a few minutes each day.
Can we talk about the Bloggers Blast? What is the event and why focus on bloggers?
I was at the Consumer Electronics Show in Vegas and attended about 5 after parties. What impressed me was they were all geared toward bloggers and social media. I knew this was something the ToonSeum had to do in Pittsburgh.
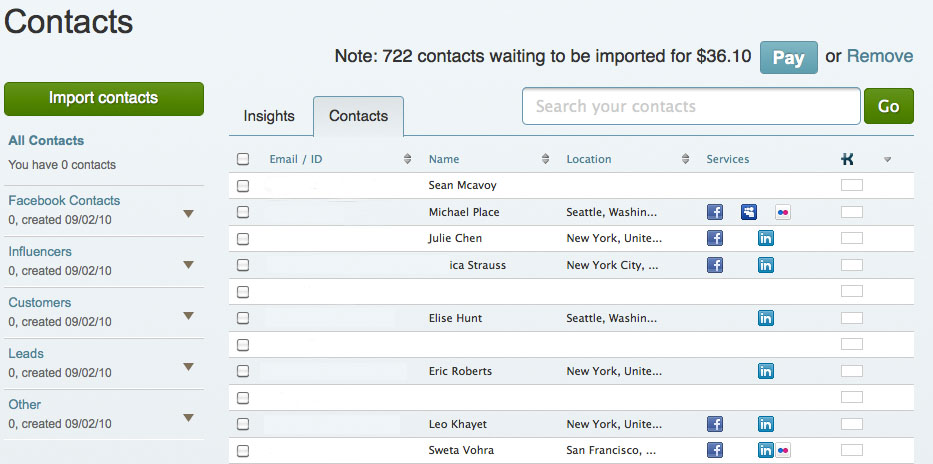
Traditional press is great, we love them! But today even they are pulling content from bloggers. Bloggers have fans, just like we do. It comes back to embracing a fan-based culture. So we wanted to let those bloggers get a sneak preview at our upcoming exhibitions and programs for 2011. We have special guests, a preview of the art, prizes and every single blogger will get a flash drive filled with all our press releases, promo art and more. If you are reading this and are a blogger, contact joe@toonseum.com for your invite.
We will be following this with tweet parties, where everyone is admitted free if they tweet about the exhibits.
You have mentioned that the ToonSeum was one of the first Pittsburgh museums to develop an iPhone app. What does the app do and what was the development process like? Has there been a good response?

Going to back to my previous experience with another museum, I was often frustrated by the phrase “we’ll look into it.” I began to realize that phrase meant, we don’t know how to do it and aren’t willing to learn. Forget the yellow pages, the phone book is dead. It’s all about web and apps. We knew we needed an iphone app. It provides immediate access to enhance the guest experience. It also goes a long way to legitimizing you to tourist. It’s one of the first things I do when I visit a venue in a new city, I check them out online and then download their app.
Creating an app can be an expensive prospect, thousands of dollars. That was out of the question for our budget. So, I just learned to do it myself. I applied for an apple developer license, found a great site that would allow me total control over the creation of the app, submitted it for approval and that was it. Total process took about five hours, not counting waiting for approvals, which took three weeks.
I used rss feeds so that info on our hours and events could be changed on the fly. I created a framework that would allow our youtube videos to be viewed from within the application. As a cartoonist it was easy to do most of the graphic design work myself and there you go. It’s done. Our social marketing intern can update it from anywhere. I can even update from my iphone when I am out of town.
If I am going to run a museum I should know how to do every job. I better know how to market, run the register, curate an exhibition and even mop the floors. I can then have a better understanding of how difficult a task is and more important I can lend a hand when it is needed.
I am working on an android app right now and we are doing a complete web overhaul in spring.
We are geeks, we love this stuff.


 The last part of our series concerns making management decisions based on data. Once you have the data, what do you do with it? As we come up with more sophisticated methods to track social media sentiment and reach, it becomes possible to track more accurately how people are responding to social media. This is especially important because social media can be a valuable part of your market research. It is like a 24-hour focus group, answering many of the questions you may have about your audience as well as the questions you didn’t think to ask.
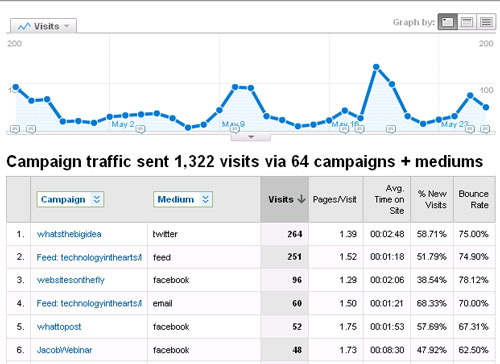
 Facebook Analytics