Management

Hype Cycle for Emerging Technologies: Distinguishing the Hype from the Viable

Making informed technology decisions means understanding the necessity, impact, and sustainability of the technology; the technology’s current 
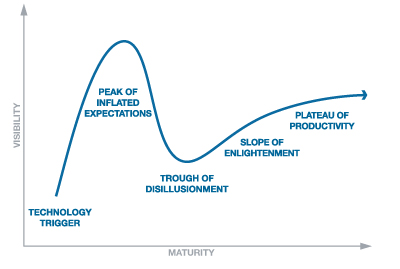
and future relevance to the industry; and how it supports the organization’s business goals.

When new technologies make bold promises, how do you discern the hype from what’s commercially viable? And when will such claims pay off, if at all? Gartner Hype Cycles provide a graphic representation of the maturity and adoption of technologies and applications, and how they are potentially relevant to solving real business problems and exploiting new opportunities.

With new technologies emerging overnight, early adopters tweeting about them by your morning coffee, and six beta invites in your inbox by your evening commute, deciding which technologies will pay off, which are relevant and which will last, is by no means a simple project. Gartner, Inc., a leading information technology research and advisory company, produces Hype Cycles to help clients  differentiate the “hype” technologies from the viable technologies. These graphics, organized by industry and aggregated in the “Hype Cycle for Emerging Technologies,” provide clients with insight to the risk, opportunity, and viability of various technologies in specific industries.

"Hype Cycle for Emerging Technologies" targets strategic planning, innovation and emerging technology professionals by highlighting a set of technologies that will have broad-ranging impact across the business. It is the broadest aggregate Gartner Hype Cycle, featuring technologies that are the focus of attention because of particularly high levels of hype, or those that may not be broadly acknowledged but that Gartner believes have the potential for significant impact.-- Jackie Fenn, vice president and Gartner fellow, August 2011 Gartner press release

In the Hype Cycle, a technology’s life has five phases. These phases are (as defined by Garnter,Inc.):

Technology Trigger: A potential technology breakthrough kicks things off. Early proof-of-concept stories and media interest trigger significant publicity. Often no usable products exist and commercial viability is unproven.

Peak of Inflated Expectations: Early publicity produces a number of success stories—often accompanied by scores of failures. Some companies take action; many do not.

Trough of Disillusionment: Interest wanes as experiments and implementations fail to deliver. Producers of the technology shake out or fail. Investments continue only if the surviving providers improve their products to the satisfaction of early adopters.

Slope of Enlightenment: More instances of how the technology can benefit the enterprise start to crystallize and become more widely understood. Second- and third-generation products appear from technology providers. More enterprises fund pilots; conservative companies remain cautious.

Plateau of Productivity: Mainstream adoption starts to take off. Criteria for assessing provider viability are more clearly defined. The technology’s broad market applicability and relevance are clearly paying off.

Many Gartner clients use Hype Cycles as part of their technology-planning process, often drawing from multiple Hype Cycles, augmented with industry- or company-specific topics to create their own Hype Cycles and Priority Matrices. Technology providers use Hype Cycles as a way to understand the likely market reaction to their products and services based on the adopter community's expectations and attitudes. Investors watch for technologies that are on the rise in a Hype Cycle to try to catch them before the Peak of Inflated Expectations or at the beginning of the Slope of Enlightenment before they move into mainstream adoption. –Jackie Fenn

Gartner’s complete reports on technology trends and in-depth analyses of the Hype Cycles can be purchased online. But for now, take a look at the Hype Cycle for Emerging Technologies (as of July 2011):

To our followers across various industries--does or will this foresight affect your technology-planning strategy?

Are Bricks and Mortar the Best Use for Money in the Arts? The Overbuild of Cultural Facilities in the United States

Recently, the University of Chicago’s Cultural Policy Center released the report, “Set in Stone: Building America’s New Generation of Arts Facilities, 1994-2008.”

Summary: The research examines the boom of major cultural building projects (museum, performing arts centers, and theaters) between 1998 and 2004, specifically looking at the decade between 1990 and 2000. The findings indicate during that period, “the level of investment in bricks and mortar as a percentage of total revenue and assets was disproportionate.” The full report addresses the landscape of cultural building, the investment determinants of cultural building, the feasibility of cultural building projects, and the effects on communities. The report takes into account population change, the national trend in ratio of arts organizations to cultural facilities, the relationship between the number of existing facilities in an MSA and the population, GDP, economic climate, municipal spending on physical infrastructure, spending by type of project, education rates, median household income levels, distribution of costs of projects (by region), geographic considerations, and other factors affecting the supply, demand and sustainability of cultural building projects.

[embed]http://youtu.be/KwhG7SK9csc[/embed]

Case Studies: Four case studies, presented as teaching resources, portray complex, management situations students and professionals might encounter in the real world. The cases (comprised using internal documents , construction data, and first-hand accounts from administrators, board members and/or volunteers involved in each situation) emphasize the need for managers to make strategic decisions, weighing the benefits and risks of each potential course of action. These studies provide a platform for discussion about the strategic design of projects, potentially shaping future design and management practice.

The four case studies highlight issues of  strategic decision making, project design, expansion and management at:

1) the Art Institute of Chicago in Chicago, IL

2) the AT&T Performing Arts Center in Dallas, TX

3) the Long Center for the Performing Arts in Austin, TX

4) the Taubman Museum of Art in Roanoke, VA

Key Findings: The report and the findings show that (taken from the report)

- Cultural institutions and arts facilities were overbuilt during the boom years

- Performing Arts Centers were the dominant form of new facilities

- The building boom affected the entire country, but was concentrated in the South, which saw enormous increases in the total number of facilities

- Building in the arts grew faster between 1998 and 2001 than or on par with building in other sectors, particularly health and education

- Rising population and higher average levels of education and income help explain why some cities built more than others

- There is no clear pattern of spillover effects (negative or positive) of specific cultural building projects on non-building local cultural organizations and the greater community

- There was far less investment in traditional theater facilities than there was in museum and performing arts centers

- The New York-Northern New Jersey-Long Island MSA spent more on cultural infrastructure ($1.6 billion) building than any other MSA during this period

- Research shows that for every additional cultural facility a city had, it invested between $0.11 and $0.23 more per capita per year in cultural building projects

- What influenced how much a city invested in cultural infrastructure was not the size of a city’s population, but how fast the population was increasing or decreasing

[embed]http://youtu.be/76vN7mb9n6E[/embed]

Looking Ahead: Joana Woronkowicz, co-author of the report, summarizes the lessons learned from the study and how the arts industry should proceed in making building project decisions.

• What is the motivation for the project?

• Does it align with organization’s artistic mission?

• Is there a need for the project (not a want), but a need?

• Do I have the leadership in place to take the project from the beginning to the end?

• Does the building project respond to the needs of the community?

• How can I be flexible in controlling expenses and nimble in generating income?

Three “How to…” Lists, One MuseumNext Conference, and a Letter to Museum Directors on Why Museum Websites Fail

The Guardian’s Culture Professionals Network reveals some of the best advice, best practices, and best tips from the arts management community.

1) 18 tips for managing your arts and heritage staff

2) How to recognize, prevent and deal with burnout in a creative job

3) 10 social media tips for arts organizations

And now, the international museum conference you must register for early! MuseumNext is Europe’s conference on social and digital media for the museum sector. For the third year in a row, registration to MuseumNext reached capacity long before the two-day conference rolled around this past May. Interested latecomers were placed on a waiting list.

What is the event about?

- Coverage of the hottest topics and technologies from the digital side of museums

- Packed schedule: keynotes, multi-track conference, workshops and more

- World class speakers and fresh perspectives from museums across the globe

- Unbeatable atmosphere: hundreds of museum geeks, networking and meet ups

- Great value: catering throughout the day, rewatch presentations online after the event and free high speed wifi.

This year’s conference was in Barcelona, Spain, with over 350 delegates from 34 countries across the globe. The topic of discussion: what’s next for museums? Speakers on this year's program included Nancy Proctor of the Smithsonian Institution (mobile strategy and revolutionary practices in museums), Tijana Tasich and Elena Villaespesa of the TATE (online metrics), Allegra Burnette of the MoMa (the Mobile Museum), and many other notable and forward-thinking figures in the museum world. To view videos of these lectures, visit MuseumNext's Facebook page.

The MuseumNext website is loaded with hot topics and insightful discussion in the arts management field. To get a feel for the scope of the content discussed, check out these articles:

[embed]http://vimeo.com/25552335[/embed]

Best Practices in the Cloud: Creating Collaborative Communities in a Common Virtual Space

Slot Shelters is an international, design conversation between young students exploring the fabric and identity of their communities—and sharing their findings and designs with their peers across the globe.

A youth building and design project leveraging traditional and online cloud tools to create a global dialog around pattern, community identity and local bus shelter needs. Locally in San Jose, the Slot Shelters project aims to instill a vision of aesthetic possibilities and anchor Silicon Valley with a sense of place.

Specifically, students address the needs of their local community's bus shelters. By creating models using cardboard and pattern cards, the students design patterns that reflect the identity, needs and environment of their community. These physical models are then transformed digitally and refined using Google SketchUp. They are saved to a Google SketchUp warehouse and shared internationally with other participating students and schools.

Why Bus Shelters? Bus stops are existing hubs in our communities. Sometimes they have shelters over them and sometimes they do not. How can you creatively re-envisioned shelters so that these waiting spots become something more for your community? How can the bus shelter you create address contemporary needs of your community?

In the process of creating and drafting these designs, students become more aware of their visual environment, more in touch with the needs of their local community, and more familiar with the design prototyping process. The digital component to the project includes 3D, digital bus shelters in a shared Google SketchUp warehouse, a downloadable online ISSUU Slot Shelters Kit, and a library of design/pattern cards for other users to print out and utilize in the and construction of their own structures.

[embed]http://youtu.be/zeonh6VKMvQ[/embed]

Currently, participating students are 4th, 5th and 6th graders from Azerbaijan, Hawaii, Utah, Washington State, San Jose and Cupertino.  In September, with the launch of the Seeking Shelter Design Challenge at the 2012 ZERO1 Biennial (a showcase of "contemporary work at the nexus of art and technology" in Silicon Valley), students will have the opportunity to submit their designs for official judging.

IMAGINE how a bus stop could be designed to renew, refresh, and connect people. Would you put in a mini community garden box? Solar cells? Bookshelves for informal book sharing? A small business kiosk?

BUILD your vision of a multipurpose bus shelter. Use slotted notecards. Use Google SketchUp.

SHARE your thoughts with us. Share concept physical models as images via Flickr or Picasa. Make a refined model in Google SketchUp and share to the “seeking shelter” 3D warehouse collection.

What does this project do so well and how can organizations learn from it?

-Collaboration and sharing: Google SketchUp (and other Google services) helps local and static projects become global and dynamic interactions

-Experiential learning in the physical realm: the Slot Shelters project begins in the physical realm, laying a foundation for the understanding of design principles and techniques before moving into the virtual realm

-Establishing communities in the virtual realm: As students build their bus shelters using Google SketchUp, they annotate each design decision. Shared online, students from across the globe involved in the product can add designs and more bus shelters to the virtual community to reflect the fibers and identity of their own environment

-Pragmatic design training: Students are given basic training with a tutorial on Google SketchUp, introducing them to the tools available, providing them with the appropriate design vocabulary and elevating their comfort level with building 3D structures in a virtual environment

-Application of project in the real-world: An installation of a conceptual bus shelter will be showcased at the 2012 ZERO1 Biennial. The public will have the opportunity to experiment with the design cards and design process by adding components to the model and working collaboratively.

Following the model of “imagine, build and share,” arts organizations can incorporate applications like Google SketchUp and VoiceThread in their educational programming and community outreach initiatives (click here for a beautiful graphic of the goals and outcomes for the project). By engaging the public in the cloud, projects and ideas become more dynamic, impactful and even international.

Love this project, love the dual-approach (physical and virtual design), and love the effort to increase awareness of the visual environment!

Americans are paying more for culture, opportunity looms on the technology front

New information out from the Consumer Price Index (CPI) indicate that Americans are spending more for both technology and entertainment (a catagory that includes cultural expenditures).  How can cultural organizations capitalize on this?  What does this mean?  Articles in both The Atlantic and NPR's Planet Money look at these trends from a more general standpoint but don't drill down on the idea for the arts.  The facts presented from the Atlantic indicate that 2007 Recreation expenditures are up by 1.7% over those from the US in 1947.  The  NPR article states that as a percentage of household income, expenditures on Entertainment rose from 5% of the total in 1947 to 6% in 2007.  This information along with the more current information from the CPI which had the Recreation Index gaining by .6% (driven in part by a 1.2% and 2.0% rise in admission to cultural events in Dec 2011 and Jan 2012) this last January give the arts sector some reason to look favorably towards the horizon.  These numbers mean recovery, and recovery means opportunity for change. The relative gains in the arts sector are paltry compared to the gains made on technology purchases in the same amount of time.  The number of personal computers in homes (worldwide), for instance, grew from 152 Million from 1993 to 2002.  The number of internet users in that same time frame went from 10.5 million to 716 million.  The growth of other tech is no less startling by most accounts.  The synthesis of the growth of technology has yet to be fully realized by the arts sector at large but this brief respite (where revenue is rebounding from recession) should be a moment where we rally to adapt.

What do these broad economic indicators mean?  Consumer confidence has been slowly recovering since the doldrums that it was in around 2008 and 2009.  As budgets start to recover and earned income from ticket and admission sales start to edge up, arts leaders will be faced with decisions about what to do with the money.  The temptation to return departments and programs to the pre-recession status quo will be strong; the opportunity, however, for transformation through technology to meet the larger changes in how people are consuming arts and culture should be the priority.

As many technologies are currently moving out of first generation and subsequently becoming less expensive the opportunity to develop interfacing content for them is also becoming less expensive.  Application development for mobile devices is, for instance, now within the fiscal reach of the arts sector.  Similarly simulcast capabilities in HD are coming into broader usage in peforming arts organizations across the country.  The time to identify and implement new technology is now.