
By: Kerry Huang, Kripa Jain, Christine Lee, Jack Rooney, Natalie Schmidt, Rebeca Varela
This study was completed as part of a MEIM Capstone Project.
In Part 1, our research team examined the history immersive entertainment industry in the United States, and current challenges facing immersive experience creators. To gain insights into the audience perspective, our team launched an online survey on January 17, 2026, examining overall engagement with immersive entertainment. The survey yielded 301 responses from individuals active on digital platforms such as LinkedIn, Instagram, and Reddit. Respondents ranged in age from under 18 to 55+, with an estimated average between 24 - 34. Distribution through social media and professional networks led to higher participation from California (38%), Pennsylvania (17%), and “Outside of the U.S.” (18%). The sample was primarily university students, entertainment professionals, and personal networks. Due to survey branching, certain sub-questions had only 21 respondents. While the data suggested emerging trends, the limited sample size constrained generalizability.
Interviews were conducted with industry experts to deepen our understanding of immersive entertainment and adjacent fields. Participants were curated across multiple verticals, including museums, economics, and technology. The conversations explored how different experiences define success, prioritize audience satisfaction, and approach production. In parallel, an online survey was conducted to measure consumer preferences related to pricing, motivations for attendance, and barriers to entry. The survey also assessed consumer behavior across the immersive experience models defined above.
Our research relied on industry-standard, publicly available reports, prioritizing the most up-to-date sources, such as Gensler’s Evolving Immersive report. These materials provided a strong framework for shaping our research plan. In addition, our team drew from reports by trusted organizations in the entertainment industry, such as AECOM Economics & Advisory and the Themed Entertainment Association (TEA). Official websites of the parent companies behind various immersive experiences also served as credible and informative resources.
Limitations of the Study
This study is subject to several limitations. Immersive entertainment projects vary widely in format, making generalizations based on scale and location difficult. The rapid evolution of the industry further complicates the analysis, as benchmarks may shift quickly with advancements in technology and changing audience behavior. Additionally, limited access to publicly available financial and attendance data for privately held operators restricts cross verification, narrowing the scope of our quantitative conclusions.
Audience Perception
The survey sample reflected an immersive-literate audience: 84% reported attending at least one immersive experience, indicating familiarity with the format. Demographically, 52% reported annual household income above $75,000 (including 11% between $75,000 - $99,999 and 41% above $100,000), suggesting discretionary spending capacity. The largest age cohort was 24-34 (43%), followed by 55+ (21%), with 35-44 and 44-55 each representing 11%, indicating cross-generational participation. Gender representation was nearly balanced (49% male, 47% female), and around half the respondents came from California and Pennsylvania, with the rest coming from 27 other states and outside the country. Overall, the sample reflected a diverse, immersive-aware audience, supporting the reliability of meaningful results despite minor distribution biases.
Survey data on the five defining attributes of immersive entertainment aligned well with the Gensler report. Respondents rated all attributes highly on a five-point scale, with mean (M) scores clustered near the upper range categories. “Leaves a lasting impression” (M = 4.11) and "narrative transportation” (M = 4.08) ranked highest, followed by “storytelling” (M = 3.99), “multi-sensory engagement” (M = 3.81), and “active participation” (M = 3.61). The relatively narrow range between means suggested three patterns: mature-audience consumption, multi-dimensional expectations, and evaluation of immersive success based on the combined delivery of emotional, narrative, and sensory elements rather than any single feature.
The most common motivation for attending an immersive experience was “trying something new or unfamiliar” (45%), reflecting a strong appetite for novelty. This finding fits with the experience economy framework proposed by Pine and Gilmore, which emphasized continual innovation to avoid commoditization (2011). As Pine noted, “The bar is raised every year…everybody is in your business. And that means you must be better or eventually you’re going to commoditize and go down.” Additional motivation included “familiarity with the story, topic, or theme” (27%) and “recommendations from friends or peers” (24%), while “social media trends” influenced only 4%. These results suggest that participation is driven primarily by curiosity, personal relevance, and trusted word-of-mouth rather than algorithm-driven virality.
Barriers & Points of Friction
Travel emerged as a primary source of friction. Most respondents (77%) reported traveling locally (within the same city or one to two hours) to attend an immersive experience. “Travel expenses” received one of the strongest influence ratings impacting attendance decisions (M = 3.58) on a five-point scale, and 32% identified “difficulty getting to the location” (travel time/cost) as the most negative factor affecting the experience. These challenges align with the emphasis on location strategy highlighted by David Luff, a pioneering producer behind Candytopia and The Museum of Ice Cream, who noted that accessibility and proximity to community are critical for sustained engagement. Thus, destination-based models require strong population density or tourism ecosystems to remain viable, whereas touring or rotating models reduce geographic risk. These findings reinforced accessibility as fundamental to perceived value, a concept Dr. Kerry Joels, a former curator at the Smithsonian National Air and Space Museum, described as the justification for an experience feeling worthy of the time and financial investment.
Among the remaining 7% respondents who had not attended an immersive experience, only 29% reported that their hesitation was due to “lack of interest.” In contrast, 62% cited “lack of awareness” of experiences, and 33% reported “uncertainty about what to expect.” The data suggested that audience reluctance stems less from disinterest and more from a communication gap between immersive practitioners and potential audiences.
Industry Perception vs. Audience Reality
Industry stakeholders currently define success primarily through attendance and revenue stability, while identifying financial risk, high production costs, and scalability as key concerns. However, audience attendance patterns suggested immersive experiences are treated as occasion-based activities. Survey data showed that a majority (77%) attend experiences occasionally, while only 12% attend monthly and 3% weekly. Figure 1 illustrates these patterns below.
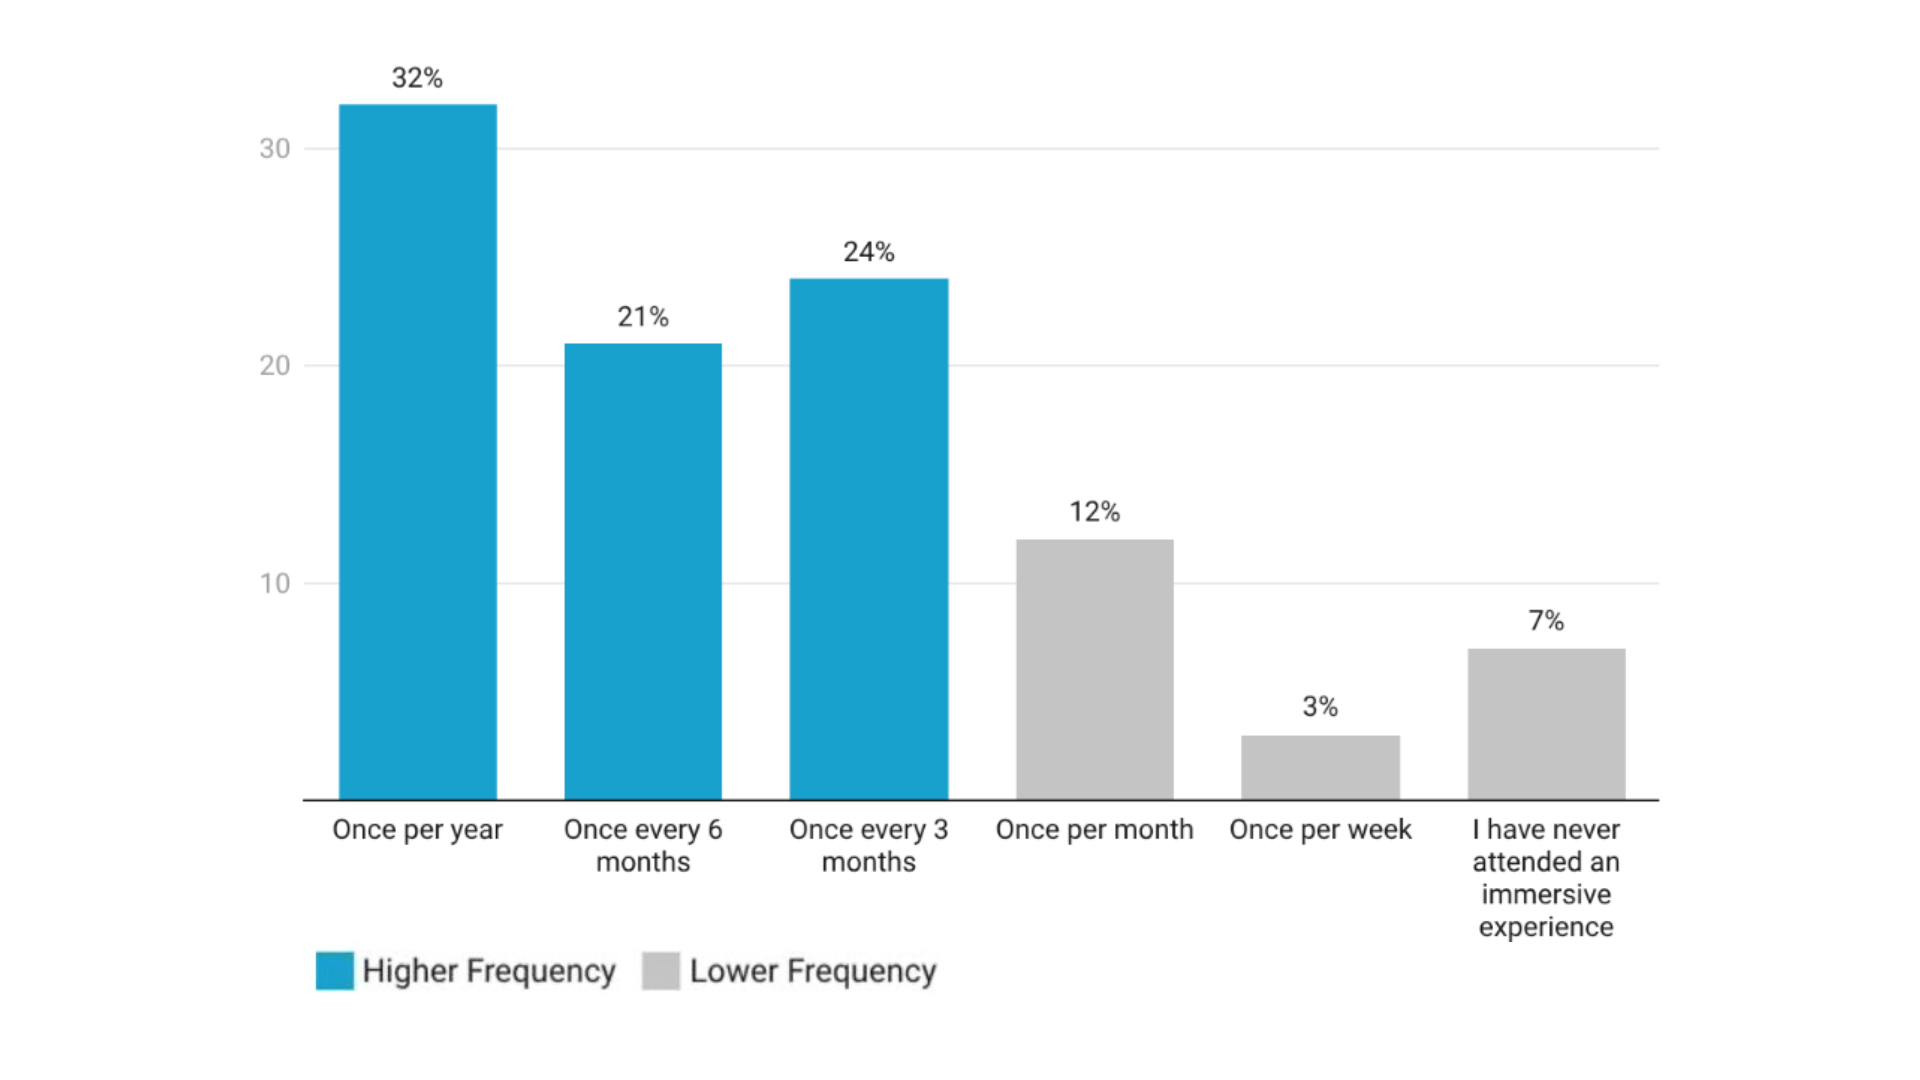
Figure 1: Frequency of Immersive Experience Attendance (2026)
Despite practitioners’ reliance on attendance, audiences viewed immersive experiences as premium, event-based outings rather than routine leisure activities. A sustainability model based solely on high-frequency attendance or repeat visitation may therefore misalign with actual consumption behavior. Instead, rotating programming, refreshing intellectual property (IP), offering seasonal activations, and touring structures may better reflect consumption patterns.
Interviewed practitioners support this approach. Dr. Joels noted that museums continually “keep it fresh” by hosting traveling exhibits with defined runs, allowing for constant rotation. Similarly, Luff distinguished between short-term market share versus longevity, emphasizing the importance of sustained engagement across multiple seasons through innovation and community alignment.
Practitioners such as Dr. Joels also emphasized the financial and operational burdens of advanced technologies (such as AR, VR, and large-scale projections), which increase capital risk and extend cost-recovery time. Audiences, however, evaluated technology based on its experiential impact, associating it with stronger storytelling and greater emotional immersion. Notably, 50% of respondents attended a VR/AR-based experience, and almost half cited technology-enabled formats when describing their ideal experience. This contrast suggested that while technology increases production risk, it simultaneously elevates perceived value.
In our survey, social media emerged as one of the primary discovery channels, yet it had limited influence on actual attendance decisions. In contrast, word-of-mouth proved far more effective in converting awareness into action, as illustrated by Figure 2 below.
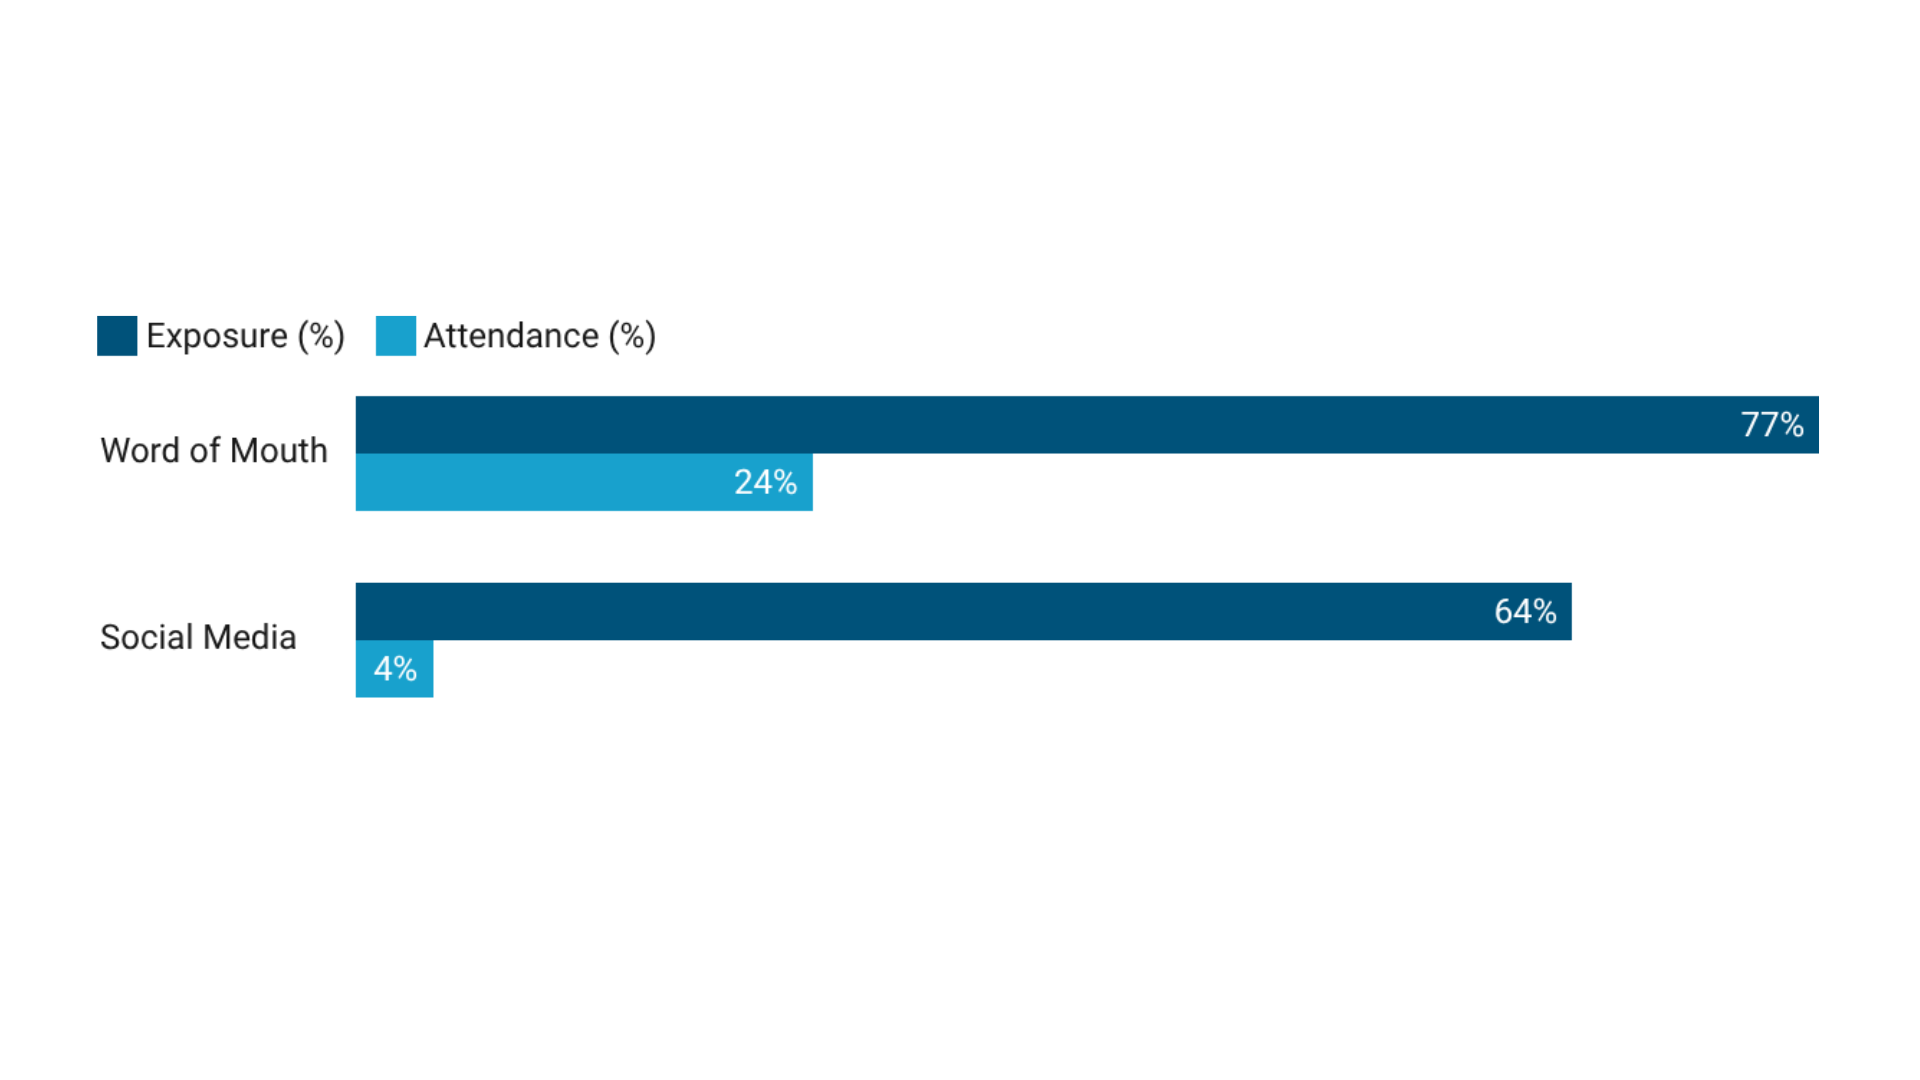
Figure 2: Awareness vs. Attendance of Immersive Experience
The effect of trusted word-of-mouth compared to social media exposure highlighted the distinction between awareness generation and customer conversion, underscoring that trusted endorsement, not reach alone, is a stronger predictor of attendance in a saturated marketplace.
Emerging Trends
The survey revealed a thematic overlap between immersive audiences and traditional entertainment preferences. Respondents reported the highest engagement with movies, museums, concerts, and live performances, while theme parks, live sports, and pop-ups attracted less interest. This pattern mirrored immersive attendance, where interactive exhibits, escape rooms, and VR-based formats were favored over large-scale permanent venues or immersive themed dining. Figures 3 and 4 below show these patterns in detail. The overlap of these results suggested a preference for narrative-driven, rotational, and moderately accessible experiences, rather than purely spectacle-driven or premium formats.
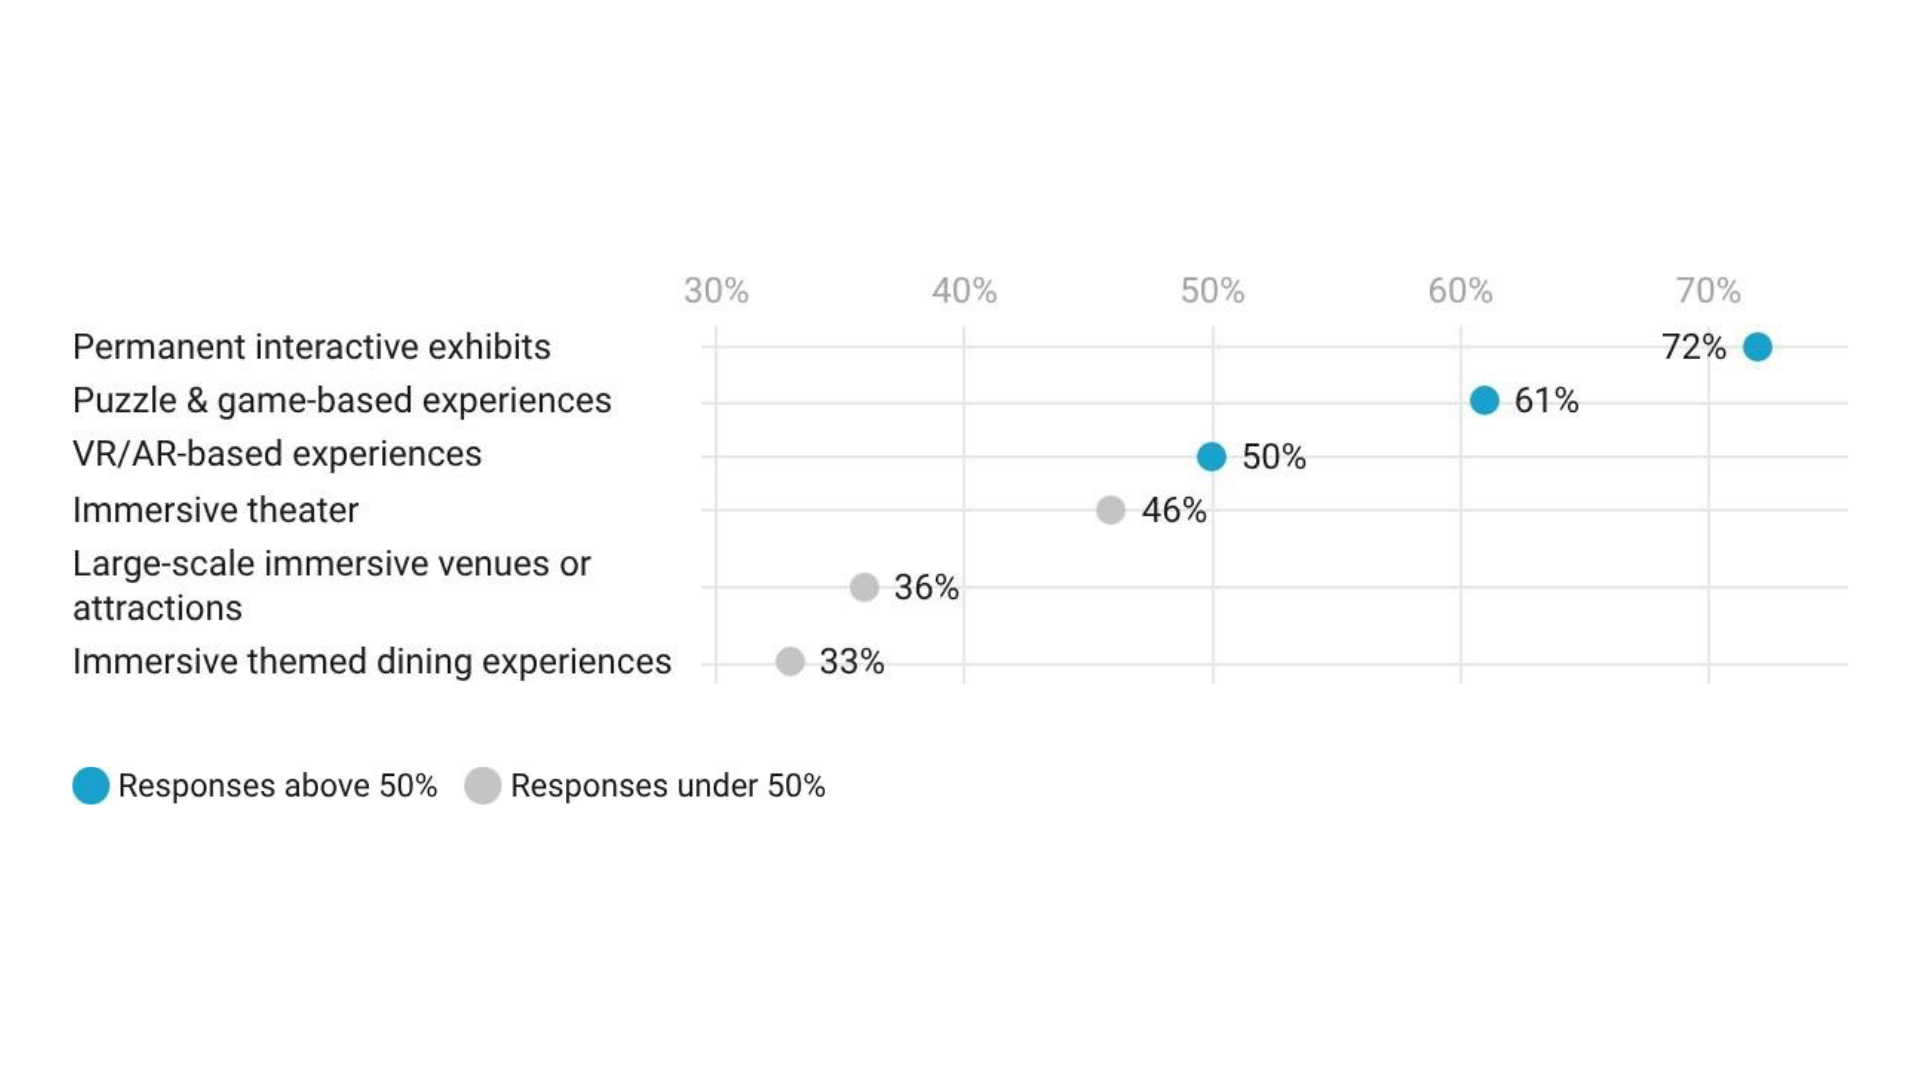
Figure 3: Attendance of Immersive Entertainment Activities in the Past
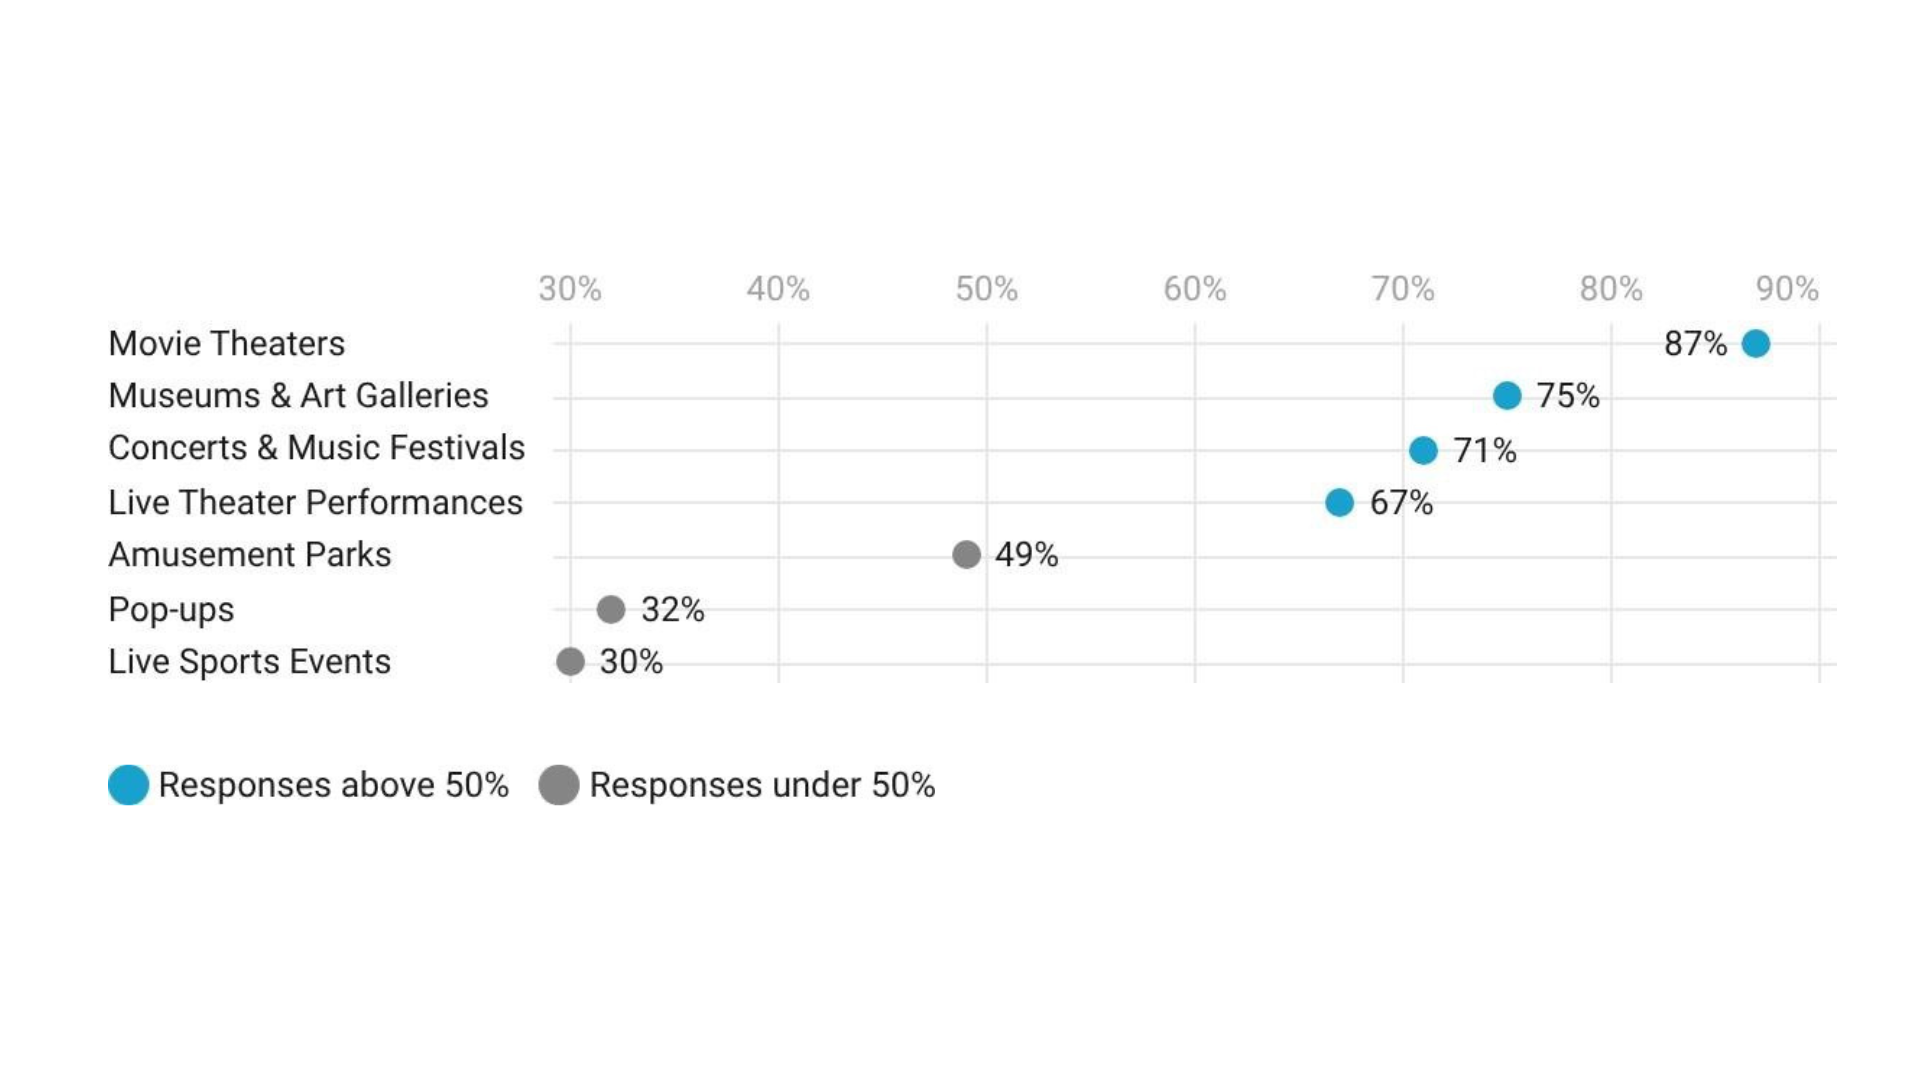
Figure 4: Attendance of Other Entertainment Activities in the Last 12 Months
“Ticket price” (M = 3.45) and “familiarity with story, topic, or theme” (M = 3.17) were among the strongest influences on attendance decisions, suggesting that recognizable narratives and manageable costs are central to attendance participation. Similarly, Pine highlighted the strategic viability of rotational or modular immersive models, whether within permanent venues or as touring concepts. He noted that by combining narrative familiarity, flexible programming, and economic accessibility, immersive projects can better sustain engagement and long-term success.
The second major trend is duration. 71% of respondents identified one to two hours as the ideal experience length. This suggests a clear threshold for justifying ticket prices based on the intensity and memorability of time spent, reinforcing the concept of Money Value of Time (MVT) proposed by Pine.
Synthesis of Findings
Non-financial indicators such as perceived time well spent, location accessibility (particularly travel friction), and lasting impressions emerged as potential leading indicators of financial sustainability. Rather than prioritizing attendance metrics alone, long-term viability may depend on prioritizing modularity within existing infrastructure and optimizing experiential return per visitor over three- to six-month operational cycles. By examining survey responses across the three models to identify some non-financial metrics that introduce five viable recommendations.
Emergence of Key Non-Financial Metrics
While our research identified areas of asymmetry similar to the industry reports cited above, our findings go further by providing empirical weight to how audience behavior should shape the practical consideration of immersive experience design and production. Practitioners and investors tend to have an overly narrow, linear focus on financial outcomes rather than a more holistic understanding of the non-financial factors that directly affect revenue, ticket sales, and Return on Investment (ROI).
The Awareness Marketing Gap
One of our most significant findings concerned the gap between practitioner messaging and audience awareness. “Immersive” is often used as a noun, a standalone buzzy term (Larsen, 2026). However, both the survey and expert interviews demonstrated that the term itself lacks widespread recognition. Our findings also substantiated that audiences are failing to attend experiences not due to disinterest, but rather from uncertainty about what the experience entails.
Further, when our survey evaluated consumers’ understanding of immersive experiences without examples, nearly one-sixth (n = 50) of respondents were unaware. Notably, when the question was framed with stimuli (e.g., examples like Van Gogh: The Immersive Experience), responses dropped by more than half the rate. This pattern suggested that unaided awareness of immersive remains low, even among immersive-literate respondents. It also confirmed our expectation that audiences remain uncertain about what qualifies as immersive entertainment and will default to more traditional entertainment options. This confusion indicated that industry terminology has yet to reach mainstream consumer familiarity, further underscoring the need for clearer, more specific market-facing messaging.

Van Gough Immersive Experience. Source: Fever
Another key finding was that exposure does not necessarily translate into attendance, which is shown in Figure 2, where conversion rate remains a challenge for social media. Social platforms consistently deliver volume when targeting and generating audience engagement, but they do not guarantee or generate trust. Our data showed word-of-mouth carried greater credibility, resulting in a 20% higher conversion rate. This distinction between simple awareness and subsequent action challenges the industry’s current emphasis on social media as a primary marketing tool. Such findings suggest that marketing cannot be dependent on social media nor reliant on the term “immersive” alone to convey value.
Audience Consumption Patterns
Figure 1 illustrates that audiences treat immersive experiences as occasional, premium outings. This contrasts with practitioner expectations of repeat visitation, highlighting a misalignment between industry assumptions and actual audience behavior. Our research points toward a more balanced approach which prioritizes short-term engagement (1-3 months) while building conditions for long-term (over 3 months) repeat visitation. Further, our analysis aligns with Pine’s emphasis on continual innovation and Joels’ observation that museums maintain relevance through traveling exhibits.
Additionally, ticket price continues to be a key factor influencing audience decisions to attend an immersive experience. In our survey, 42% identified it as a “strong influence,” while 12% selected it to be the “deciding factor”. This finding highlights the importance of how the audience perceives value for money. As Pine mentioned, one way to understand this is to look at the MVT, i.e., how much a visitor pays relative to the time they spend in the experience. For context, movie theaters tend to offer a lower cost per minute, and theme parks a slightly higher cost per minute for the same reason. Given the sensitivity of audience behavior to ticket price, some might hesitate to engage with experiences that feel relatively expensive, making it critical for operators to justify the price through perceived value or rethink how pricing and duration align with audience expectations.
Audience Preferences
Another point of contention between practitioners’ concerns and audiences’ expectations is technology. Practitioners like Dr. Joels emphasized the financial and operational challenges of using advanced technology. Overinvesting in advanced technology poses a significant financial risk, especially for small or independent practitioners who are already struggling to secure basic funding (Nelson et al., 2024). Despite these concerns, almost 50% of our respondents desired technology-enabled formats in future immersive experiences, citing stronger storytelling and greater emotional investment. Moreover, survey participants were particularly engaged with experiences that incorporate high levels of technology and digital spectacle. These findings can be observed in both individual experiences and larger-scale venues like theme parks, which widely utilize elements such as sensory interactivity, enhanced visuals through animatronics, and engagement with IP through character mascots. As such, factors pertaining to personalized technological integration can drive emotional and physical engagement.
Key Indicators of Success
Our analyses identified three underutilized non-financial metrics drawn from adjacent industries that should be considered as key indicators of success in immersive entertainment: Conversion Rate, Variety of Audience Demographics, and Experiential Density.
Increasing Conversion Rate
As the industry increasingly relied on awareness as a metric, our data showed that Conversion Rate was a far stronger predictor of success. Conversion Rate, a marketing term, concerns how companies turn awareness of immersive experiences into actual visits. Our first recommendation is to provide more descriptive positioning and marketing language to better align the quantity of their potential audience with the quality of conversion.
Since the term clearly serves more as a barrier to audience members than as a hook, Gensler should not focus solely on marketing an experience as “immersive.” Rather, they should move beyond using the word as a noun and treat it as an adjective (e.g., “immersive theater”).
Universal’s Horror Unleashed. Source: Area15
The ambiguity with the term “immersive” is leading audiences to be apprehensive about the value of an experience and the worthiness of their time spent in it. As Pine repeatedly emphasizes, time well spent is a central factor in measuring the success of an experience.
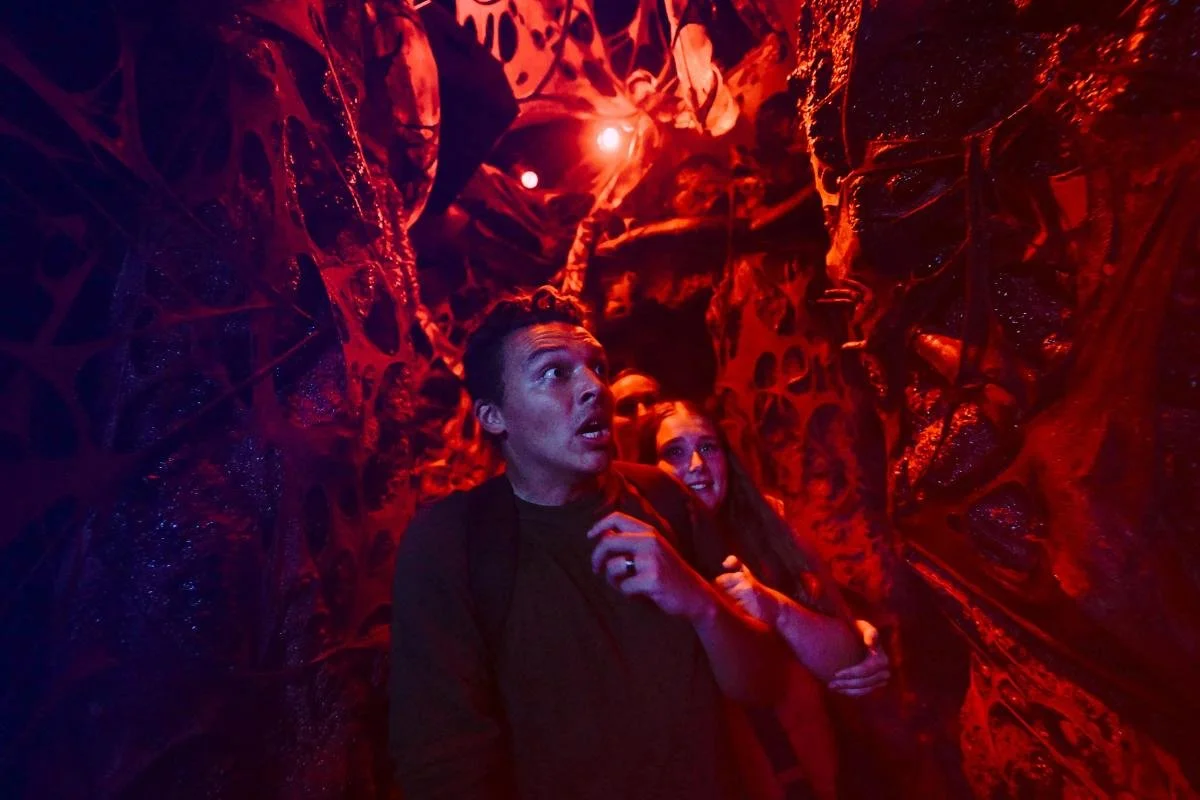
As the industry is in a critical stage of maturation, experiences must make their value immediately legible and tangible. According to our research, experiences are marketed more effectively when paired with the language of more familiar entertainment forms. For example, Universal Horror Unleashed does not market itself solely as an immersive horror experience. Instead, it describes the venue as “bring[ing] movies and nightmares to life right here in Las Vegas. Step inside a horror-themed warehouse where you can explore, eat, and scream” (Theme Index, n.d.). Here, the additional descriptive terms help the audience visualize the experience rather than leaving room for confusion about what the experience is. This exemplary use of language contrasts with The Immersive Nutcracker’s marketing language, which describes itself as “the ultimate holiday experience for the entire family” (Immersive Nutcracker, n.d.) and is less illuminating on what to expect. Investors, too, gain confidence through the familiarity of such terms. Overall, "immersive" must go beyond a strong adjective hook and describe the experience in ways that both convince the market that the experience is worthwhile and assure investors that the project will be sustainable.
Gamifying the Experience
Instead of depending on paid media tactics to increase Conversion Rate, immersive experiences should also strive to install more interactive elements that authentically encourage word-of-mouth. Our second recommendation is to gamify the experience, which means designing interactive systems that motivate audiences to participate more frequently by transforming visits into repeatable, goal-oriented play. As seen in the Mario Kart Bowser’s Challenge ride at Universal Studios, gamification is integrated through points, badges, and leaderboards that show riders’ high scores (Universal Studios Hollywood, n.d.). Such mechanics encourage audiences not only to attend once but also to return in pursuit of higher scores, new challenges, or unlockable content. Director of Immersive Experiences at NBCUniversal Victor Lugo mentions in an article that “...we want people to come back over and over again to be further immersed. Part of it is creating attractions that change the way you play every single time” (Hayner, 2023, para. 9). Gamification and interactivity enhance fan culture and thus word-of-mouth as it provides a structured reason to return, deepening the connection audiences form with the venue.
The strategy can also achieve higher word-of-mouth by scaling across locations and formats with cross-promotional activities. For example, the Orlando and Hollywood Universal Studios could engage in a competition with each other on the Mario Kart Bowser’s Challenge ride for highest points collected. Implementing such activities can cultivate a friendly, localized rivalry and strengthen brand loyalty, leading a highly sustainable effort in encouraging routine attendance. David Luff highlighted in his interview that making experiences tactile, interactive, and fun is the future. His statement implies the importance of creating an environment where fans are incentivized to return. This second recommendation reframes how value is communicated to fans. Gamification offers a legible pathway for audiences to understand why an experience is worthwhile by providing concrete actions to take, goals to pursue, and rewards to earn.
Diversifying Revenue Streams
With most audiences visiting an immersive experience only after three months, practitioners should shift from relying solely on repeat visits to also focusing on short-term attraction across varied demographics. The metric Variety of Audience Demographics captures the diversity of audience groups, both demographically and financially. In service of this metric, our research team recommends adopting a standardized MVT framework. A consistent approach across the market would help designers understand how different audience segments perceive pricing, enabling the design of experiences to appeal to multiple demographics rather than a single niche.
At the same time, programming should be diversified. Concurrently offering a mix of formats, themes, and price points within the same experience venue can broaden audience reach and maintain relevance. Audiences could then choose the MVT most appropriate for their consumer behavior and continually engage with a range of novel experiences. This approach would attract new visitors in the short term while encouraging long-term repeat visits to give fresh reasons to return. For example, a $50 two-hour VR/AR experience targets only those who are willing to pay 42¢ per minute and interested in digital formats, limiting both audience size and appeal. However, if one adds a 90-minute escape room at $30 (33¢ per minute) alongside it, the venue introduces a new format at a lower price point, attracting a wider demographic.
Maximizing Experience Density
The novelty of technology alone is not sufficient to sustain audience engagement in the long term. As Nathan Huber, Co-Founder of Liminal Space, noted, “technology has a short window of being novel.” Therefore, the use of technology must be an intentional element of the experience, specifically designed to enhance audience engagement, rather than leveraged as a marketing tactic.
Experiential Density refers to “the richness of emotional, cognitive, and sensory engagement within a given time and place” (Schlappig, 2026, para. 4). The term originates in the development phase of experience design and game design. Our research team recommends applying the term more broadly as a metric to evaluate the elements of engagement within an immersive experience on a per minute basis.
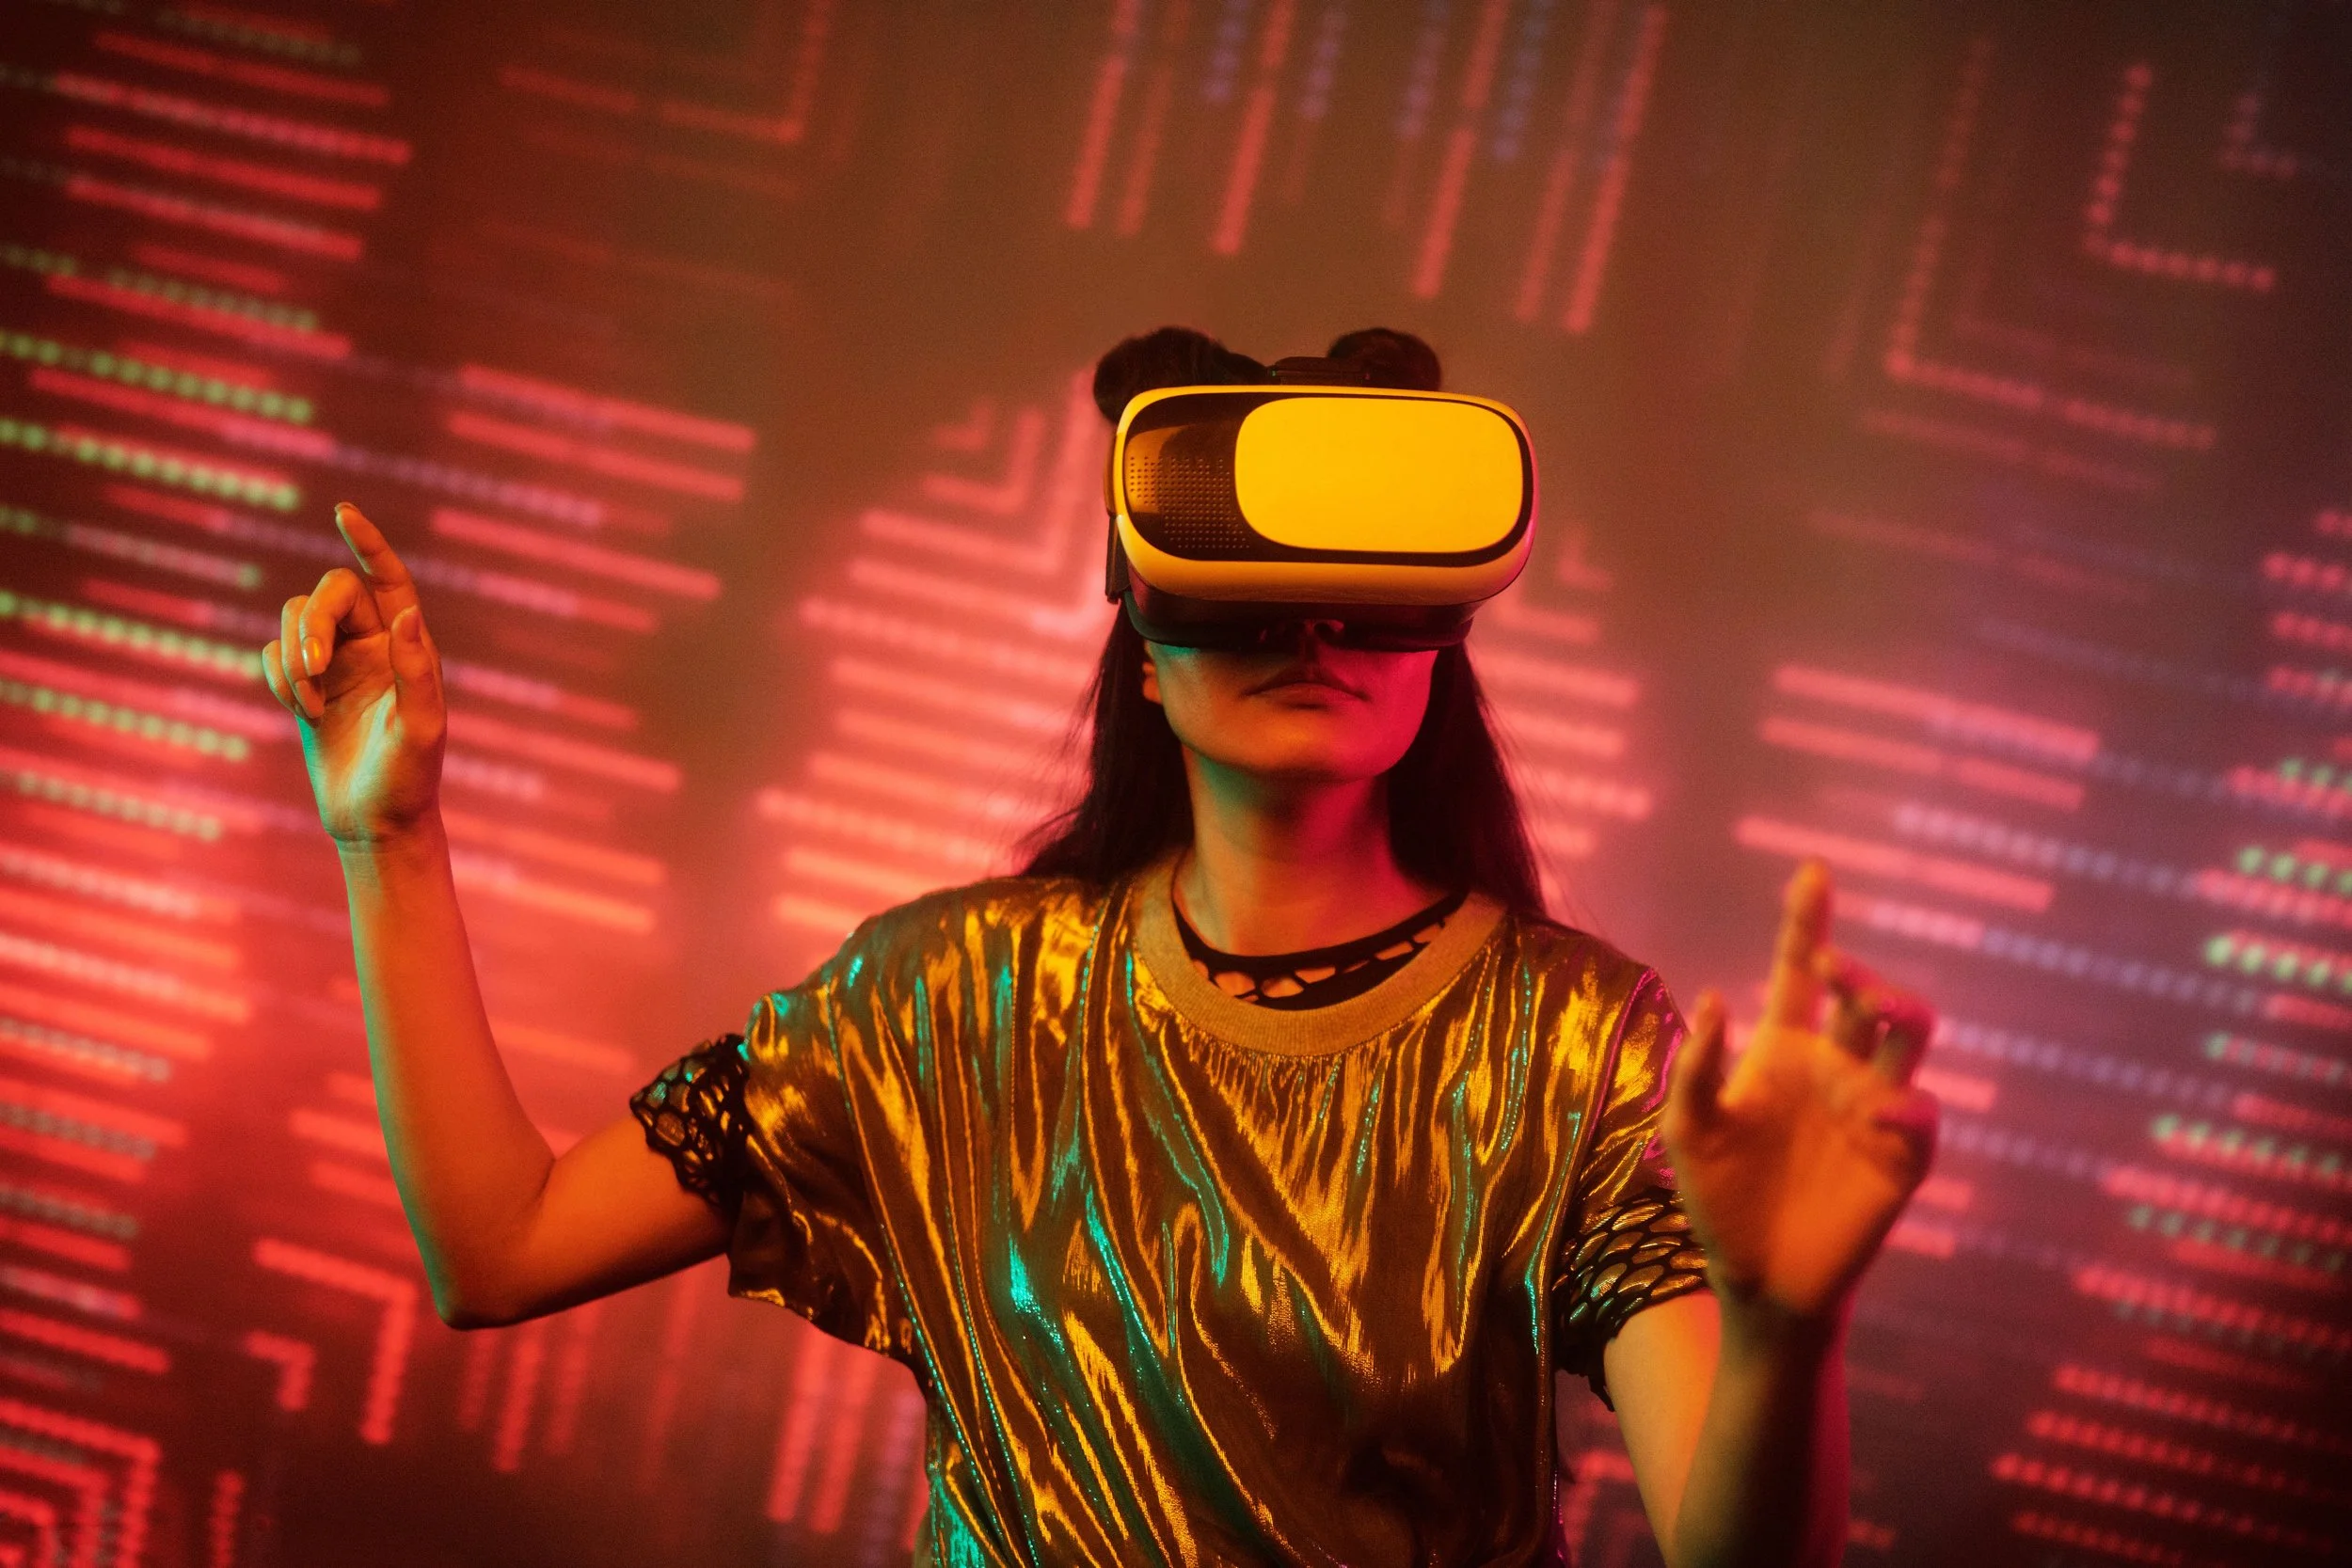
Image by Darlene Alderson Source: Pexels
For example, Dreamscape Immersive is an experience that puts visitors into a VR world as a story unfolds around them. Even though the technology is impressive, the Experiential Density is low as visitors are mainly passive observers outside of a few points of minor interaction. Partnerships with popular IPs such as Harry Potter were not enough to save this experience from closing most of their locations. Dreamscape Immersive ultimately failed because the novelty of their VR technology diminished over time and did not sustain audience engagement. There needs to be continued investment in thoughtful technological innovations that increase Experiential Density to sustain engagement throughout the lifespan of the experience.
Given that audiences treat immersive experiences as occasional rather than habitual, Gensler should prioritize incorporating and continually innovating with experientially significant technology wherever possible to maximize audience engagement moment to moment. This approach to technology is connected to ROX, a term coined by Pine (2020) in earlier work, which states that the more the audience engages with your experience, the higher the ROX they receive. Intentionally incorporating emotional and strategic engagement into the design will offer a more holistic experience for your audiences (Pine, 2020). Incorporating technology that also increases Experiential Density rather than purely for novelty would ensure greater sustainability for the experience.
Applying the Immersive Plaza Model
The three non-financial metrics discussed above provide guidance on aligning the audience’s perception on experiential value with practitioners’ operational design. While our research team expected one of our three models (Destination, Rotating, Touring) to be definitive in successfully addressing the challenges of the investors, none emerged as a standout model. Consistent with Nelson’s report, our team concluded that amongst the existing models, a “one-model-fits-all” approach would be limiting and instead synthesized our findings towards a fourth new model: the Immersive Plaza model.
The Immersive Plaza model is flexible and modular at its core. It functions as a retail entertainment hub, where multiple experiences co-exist through plug-and-play systems across both space and content. This model provides a consistent foundational infrastructure for audiences to return to, while diversified formats introduce ongoing novelty catering to varied audience demographics. It is a free-to-enter space, offering a variety of immersive experiences priced at different levels and MVT averages, including food and beverage, merchandise, hospitality, and more. Essentially, the variety of experiences offered provides a space that meets the needs of different demographics, making it attractive on a broader scale and thus engaging a larger audience from fans to casual visitors.
While this model is not yet formally defined in the industry, successful case studies like AREA15 in Las Vegas and Netflix House in Dallas and Philadelphia demonstrate the majority of the principles of this model. First, the new model breaks free of the overreliance on the term “immersive” and uses language familiar to both investors and audiences. “Plaza” communicates the venue style as a free-to-enter public gathering space for social interaction and leisure activities, providing clarity about expectations to potential audiences so there is greater understanding of the experience being offered. Second, unlike Destination and Rotating models that require high population density or Touring models that depend on real estate risk, a plaza-style model offers variety in both programming and scale. By offering multiple entry points like the experiences at Netflix House (e.g., Stranger Things, Squid Game, or Bridgerton), these spaces ensure that visitors can always find at least one familiar IP or experience that motivates conversion while also offering a higher Experiential Density. Cross-venues (e.g., Netflix House Dallas and Philadelphia) could also leverage gamification of attendance patterns, strengthening local fan engagement and thus stronger word-of-mouth.
Modularity derived from a hybrid venue and experience design should considerably mitigate investor risk, allowing continuous innovation of the experience. The ability for operators to plug-and-play fresh experiences (potentially alongside IP anchors) into a dedicated immersive destination offers investors a way to effectively diversify their experience portfolios. Finally, the hybrid model prioritizes Experiential Density with technology integration. Modular design allows for flexible integration, interactivity, and spectacle, addressing the most common motivations for attending an immersive experience. This model can also incorporate dining and merchandise options to further attract customers and boost density.
As people spend more time engaging in various experiences, they are more likely to invest in both physical and emotional ways. Therefore, our new model drives home its exemplary nature in providing value for both customers and investors, successfully encouraging flexibility in audience decision-making to deem their visit worthy of entry.
Conclusion
Our research proposes three non-financial metrics as key indicators of success for the immersive entertainment business: Conversion Rate, Variety of Audience Demographics, and Experiential Density. To improve conversion, “immersive” should be used as a descriptive, contextual adjective rather than a standalone term. To cater to a varied audience demographics, practitioners should standardize Money Value of Time while diversifying content and IP offerings, enabling both short-term audience attendance (1-3 months) and sustained, long-term repeat engagement (over 3 months). Enhancing Experiential Density depends on continuous integration of evolving technologies and content to refresh novelty, deepen engagement and maximize overall ROX.
Building on these findings, our research team formalized a hybrid business model; the Immersive Plaza model. This model possesses a modular and scalable framework that operationalizes all three core metrics. Through the integration of audience attendance, accessibility across age and economic segments, variety in content and technology, and experience richness in a single ecosystem, the Immersive Plaza model offers a sustainable path forward for the immersive entertainment business, aligning the audience expectations with continued industry growth.
-
961 Interactive. (2025, October 14). Discover AREA15: Las Vegas' immersive playground hub. AREA15. https://area15.com/discover-area15-las-vegas-immersive-playground-hub/
AREA15 surpasses 15 million visitors, debuts new expansion—Nevada Business Magazine. (2025, August 26). Nevada Business Magazine. https://nevadabusiness.com/2025/08/area15-surpasses-15-million-visitors-prepares-for-aug-14-expansion-debut/
Campbell, M. (2026, January 9). Behind the buzzwords: What "immersive" actually means. Just Honest Experiential Agency. https://www.justhonestevents.com/post/behind-the-buzzwords-what-immersive-actually-means
Candytopia. (n.d.). https://candytopia.com/
Competing for customer time. (2021, September 1). Duke Corporate Education.https://www.dukece.com/insights/competing-for-customer-time/
Cosm. (2021, January 1). Shared Reality – The “Reality Technology” of the future, today. Cosm. https://www.cosm.com/news/shared-reality-the-reality-technology-of-the-future-today
David. (2025, January 16). LED (light-emitting diode) explained. Soldered Electronics. https://soldered.com/learn/led-light-emitting-diode-explained/
Dolby. (n.d.). What is spatial audio? How it works and how to use it. https://www.dolby.com/experience/home-entertainment/articles/what-is-spatial-audio/
Dreamscape Immersive. (n.d.). Dreamscape - a virtual reality experience like no other. Dreamscape Immersive. https://dreamscapeimmersive.com/
Fernando, J. (2026, February 18). What is return on investment (ROI) and how to calculate it.
Investopedia. https://www.investopedia.com/terms/r/returnoninvestment.asp
Frank. (2023, September 19). Disney plans to expand parks investment, doubling capital expenditures over 10 years. The Walt Disney Company. https://thewaltdisneycompany.com/disney-plans-to-expand-investment-in-parks-business/
Fritz, B. (2017, September 26). Virtual Reality Installations to Start Arriving at AMC Movie Theaters Next Year. The Wall Street Journal . https://www.wsj.com/articles/virtual-reality-installations-to-start-arriving-at-amc-movie-theaters-next-year-1506430801
Genovese, S. (2023, September 20). Marketing communications: What is B2B marketing?
Marketing Communications | West Virginia University. https://marketingcommunications.wvu.edu/professional-development/marketing-communications-today/marketing-communications-today-blog/2023/09/20/what-is-b2b-marketing
Hayes, A. (2025, September 26). Understanding word-of-mouth marketing: Strategies and benefits for businesses. Investopedia. https://www.investopedia.com/terms/w/word-of-mouth-marketing.asp
Hayes, M., & Downie, A. (2025, November 17). What is augmented reality? IBM. https://www.ibm.com/think/topics/augmented-reality
Hayner, Chris. “Theme Parks Are Turning Into Real-Life Video Games, And Minion Land At Universal Studios Is The Next Step.” GameSpot, August 24, 2023. https://www.gamespot.com/articles/theme-parks-are-turning-into-real-life-video-games-and-minions-land-at-universal-studios-is-the-next-step/1100-6517195/.
Immersive entertainment business analysis report 2025: Global market to grow by over $340 billion during 2024-2030, increasing consumer demand for hyper-realistic experiences drives growth—ResearchAndMarkets.com. (2025, April 16). Business Wire. https://www.businesswire.com/news/home/20250416220291/en/Immersive-Entertainment-Business-Analysis-Report-2025-Global-Market-to-Grow-by-Over-%24340-Billion-During-2024-2030-Increasing-Consumer-Demand-for-Hyper-Realistic-Experiences-Drives-Growth---ResearchAndMarkets.com
Immersive entertainment market size | Industry report, 2030. (n.d.). Grand View Research. Retrieved November 2, 2025, from https://www.grandviewresearch.com/industry-analysis/immersive-entertainment-market-report
Immersive exhibitions based on artists such as Van Gogh and Dali derided as "money grab" | Art | The Guardian. (2024, January 24). The Guardian. https://www.theguardian.com/artanddesign/2024/jan/24/immersive-exhibitions-based-on-artists-such-as-van-gogh-and-dali-derided-as-money-grab
Immersive Nutcracker. (n.d.). A Winter Miracle. Immersive Nutcracker. https://immersive-nutcracker.com/
Immersive theatre: A response to the demands of the contemporary audience—LetsGo. (n.d.). LetsGo. https://www.letsgocompany.com/immersive-theatre-a-response-to-the-demands-of-the-contemporary-audience/
Immersive Van Gogh exhibit owner, Lighthouse Immersive, files for bankruptcy—Bloomberg. (2023, July 27). Bloomberg. https://www.bloomberg.com/news/articles/2023-07-27/company-behind-immersive-van-gogh-exhibit-files-for-bankruptcy
Johnson, A. M., & Ashton, G. (2024). The 5 attributes that define an immersive experience. Gensler. https://www.gensler.com/blog/the-5-attributes-that-define-an-immersive-experience
Lamb, R. (2023). Virtual reality - an overview. In International encyclopedia of education (4th ed.). ScienceDirect. https://www.sciencedirect.com/topics/social-sciences/virtual-reality
Larsen, J. (2026). What does "immersive experiences" even mean? [LinkedIn page]. LinkedIn. Retrieved April 5, 2026, from https://www.linkedin.com/pulse/what-does-immersive-experiences-even-mean-jonas-larsen-clo9c/
Movie theater attendance statistics: ZipDo education reports 2025. (2025, May 30). ZipDo. https://zipdo.co/movie-theater-attendance-statistics/
Museum of Ice Cream. (n.d.). Altieri. https://www.altieri.llc/project/museum-of-ice-cream/
Museum of Ice Cream. (2026, March 27). Visit the Museum of Ice Cream: Fun interactive museum. https://www.museumoficecream.com/
National Air and Space Museum. (n.d.). Homepage. https://airandspace.si.edu/
Nelson, N., Brigante, R., Chin, J., Elger, S., Fechtor, K., Johnson, A. M., & Yu, K. E. (2025).
Evolving immersive: The 2025 immersive entertainment & culture industry report.
Netflix. (n.d.). Netflix House – Netflix just got real. https://www.netflix.com/house
Pine, B. J., II, & Gilmore, J. H. (2011). The experience economy, updated edition. Harvard Business Review Press.
Pine, B. J., II. (2020, January 30). The new experience economy [Webinar]. Harvard Business Review. https://hbr.org/webinar/2020/01/the-new-experience-economy
Santos, J. C., Sejfia, A., Corrello, T., Gadenkanahalli, S., & Mirakhorli, M. (2019). Achilles' heel of plug-and-play software architectures: A grounded theory based approach. Proceedings of the 2019 27th ACM Joint Meeting on European Software Engineering Conference and Symposium on the Foundations of Software Engineering, 671–682. https://doi.org/10.1145/3338906.3338969
Schlappig, B. (2026, January 10). Experience density travel: Why fewer locations are delivering deeper personal transformation. 500 x 136. https://www.lifeblogs.org/travel/experience-density-travel-why-fewer-locations-are-delivering-deeper-personal-transformation.html
Schur, M., & Olson, S. (n.d.). Trends to watch shaping the future of wellness. Gensler. Retrieved November 21, 2025, from https://www.gensler.com/blog/trends-to-watch-shaping-the-future-of-wellness
Sherman, A. (2025, February 5). Immersive sports firm Cosm eyes international expansion, funding round. CNBC. https://www.cnbc.com/2025/02/05/immersive-sports-firm-cosm-eyes-international-expansion-funding-round.html
Sphere Entertainment Co. - The Wizard of Oz at Sphere reaches more than 1 million total tickets sold and over $130 million in ticket sales. (n.d.). Sphere Entertainment Co. Retrieved November 22, 2025, from https://investor.sphereentertainmentco.com/press-releases/news-details/2025/The-Wizard-of-Oz-at-Sphere-Reaches-More-Than-1-Million-Total-Tickets-Sold-and-Over-130-Million-in-Ticket-Sales/default.aspx
TCG releases 44th annual research report: Theatre Facts 2023. (n.d.). Theatre Communications Group. Retrieved November 21, 2025, from https://tcg.org/Web/Web/News/Press-Releases/TCG-Releases-44th-Annual-Research-Report--Theatre-Facts-2023.aspx
Theme Index. (n.d.). AECOM. Retrieved November 21, 2025, from https://aecom.com/theme-index/
Universal Horror Unleashed. (n.d.). https://www.universalhorrorunleashed.com/en/us
Van Gogh Exhibition: The Immersive Experience. (n.d.). Retrieved November 21, 2025, from https://vangoghexpo.com/
Universal Studios Hollywood. “Mario KartTM: Bowser’s Challenge.” April 29, 2026. https://www.universalstudioshollywood.com/web/en/us/things-to-do/rides-and-attractions/mario-kart-bowsers-challenge.
Walsh, G. (n.d.). Gen Z spending habits: The trends marketers need to know in 2025. GWI. Retrieved November 21, 2025, from https://www.gwi.com/blog/gen-z-spending-habits
What is Cosm? (n.d.). Cosm Help Center. Retrieved November 21, 2025, from https://help.cosm.com/en/articles/8850594-what-is-cosm
Whitler, K. A. (2014, July 17). Why word of mouth marketing is the most important social media. Forbes. https://www.forbes.com/sites/kimberlywhitler/2014/07/17/why-word-of-mouth-marketing-is-the-most-important-social-media/
WIPO. (n.d.). What is intellectual property (IP)? https://www.wipo.int/en/web/about-ip
Will Habit. (2019, September 9). Dreamscape Immersive. YouTube. https://www.youtube.com/watch?v=IJjtEvT9JFk
Zeitchik, S. (2017, September 27). Hoping to bring VR to the multiplex, AMC joins Spielberg in backing Culver City Startup. Los Angeles Times. https://www.latimes.com/entertainment/movies/la-fi-ct-dreamscape-amc-vr-20170926-story.html
Zhang, Z. (2021, August 5). “Harry Potter” VR experiences launch at Harry Potter New York. KIWI design. https://www.kiwidesign.com/blogs/news-1/harry-potter-vr-experiences-launch-at-harry-potter-new-york?srsltid=AfmBOop28I-OAXOPAmo1K6vQVfMwMxIhRvo1y_XLskg1_J0lkj0wZNfp