
Museums are characterized by their collections - holding, preserving, displaying, and interpreting many of the artifacts we deem to be culturally valuable. Due to the tangible nature of their work, museums are highly vulnerable to the impacts of climate change and associated natural hazards like wildfires, hurricanes, extreme heat, or flooding. Even in cases when collections are not completely destroyed, small environmental changes can cause irreparable damage to museum collections, which often have specific conservation requirements for temperature, humidity, and light (Cooper).
A natural hazard is an environmental event, such as a tornado, earthquake, wildfire, or hurricane, which may pose a threat to humans. This hazard becomes a natural disaster when it causes significant harm to a community, like fatalities or property damage. The impacts of natural hazards are intensified by the impacts of global climate change - hotter temperatures create longer dry seasons which may intensify wildfires, and rising water levels add “fuel” increases frequency and magnitude of storms and flooding.
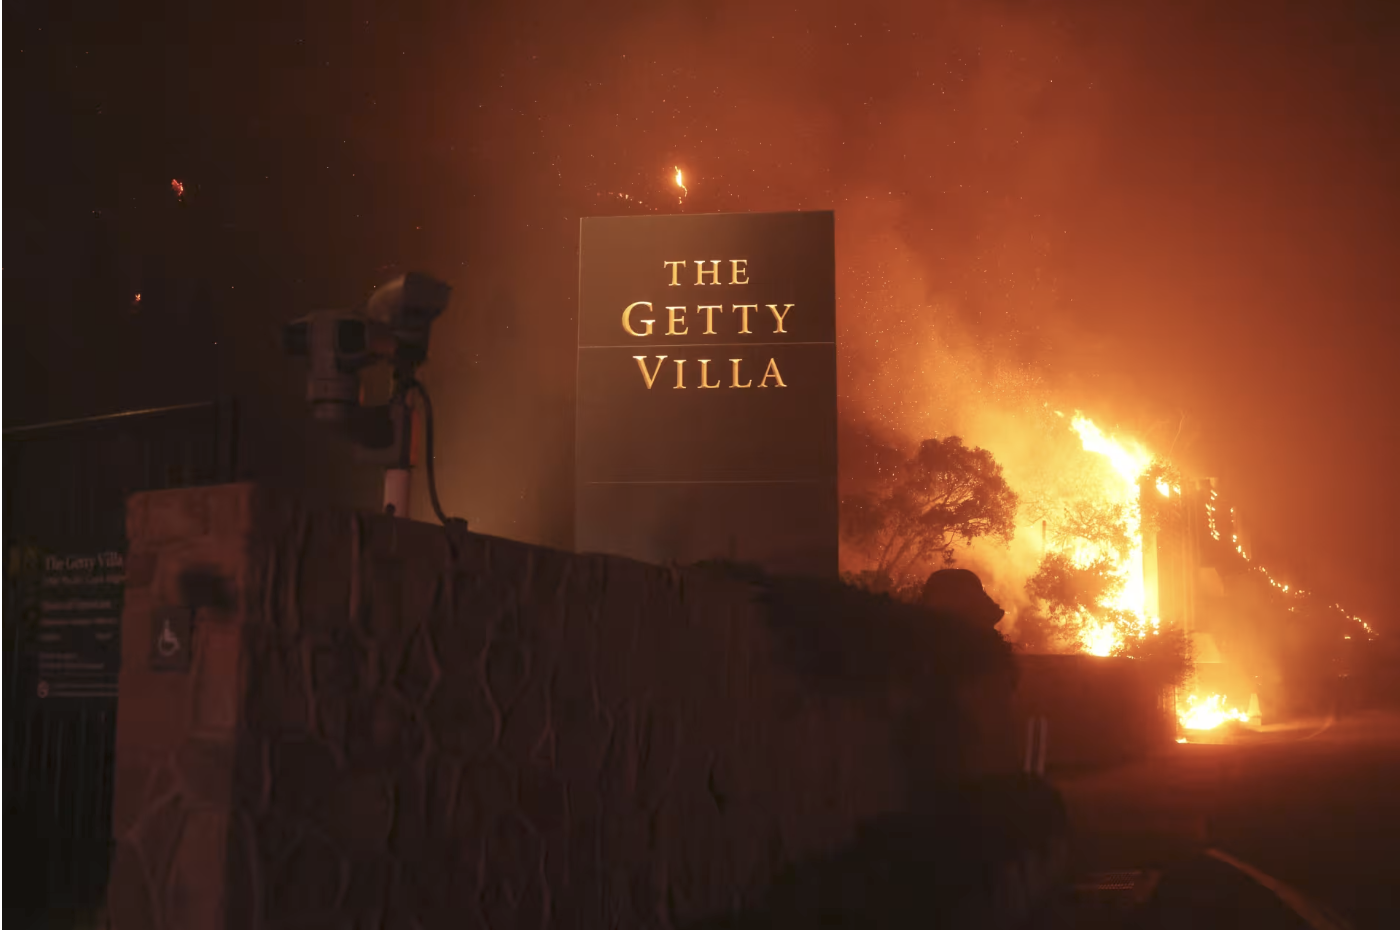
In recent years, museums have made headlines as they face significant damage and loss. In the 2025 Los Angeles wildfires, the Getty Villa campus was nearly surrounded by flames, but the collection remained secure as a result of heavy investment in fire-resistant infrastructure (Stevens). In 2023, wildfires in Maui destroyed numerous museums and heritage sites, and with them, centuries of history and culture (Artnet News, 2023). Additionally, in October 2024, a number of museums in Florida and North Carolina sustained damage from Hurricanes Milton and Helene, causing them to shut their doors for weeks (The Art Newspaper, 2023).
Image 1. Source: Wall Street Journal. David Swanson/Agence France -Presse/Getty Images
Considering the actual and potential loss, understanding natural hazard risk can have serious implications for museums. In anticipation of these types of disasters, museums are adopting a variety of risk assessment and preparedness measures.
There are three common frameworks for addressing climate-driven natural hazard risk: adaptation, mitigation, and resilience. Adaptation refers to the ability to make adjustments to infrastructure to lessen the impacts of a disaster - for example, installing sea wall for hurricanes, or seismic shock systems for earthquakes (DLA Piper). While this does not inherently address the occurrence of the natural hazard, adaptation makes a city or structure more resistant to damage. Mitigation is addressing the occurrence of a natural disaster by taking action to reduce environmental impact more broadly. Resilience refers to the capacity an institution or community has to recover after a disaster.
As the impacts of climate change rapidly progress, each of these elements is needed to avoid the worst consequences of natural hazards. Each of these three concepts overlap and influence each other, as successful mitigation reduces the need for adaptation, and adaptation reduces the need for resilience.
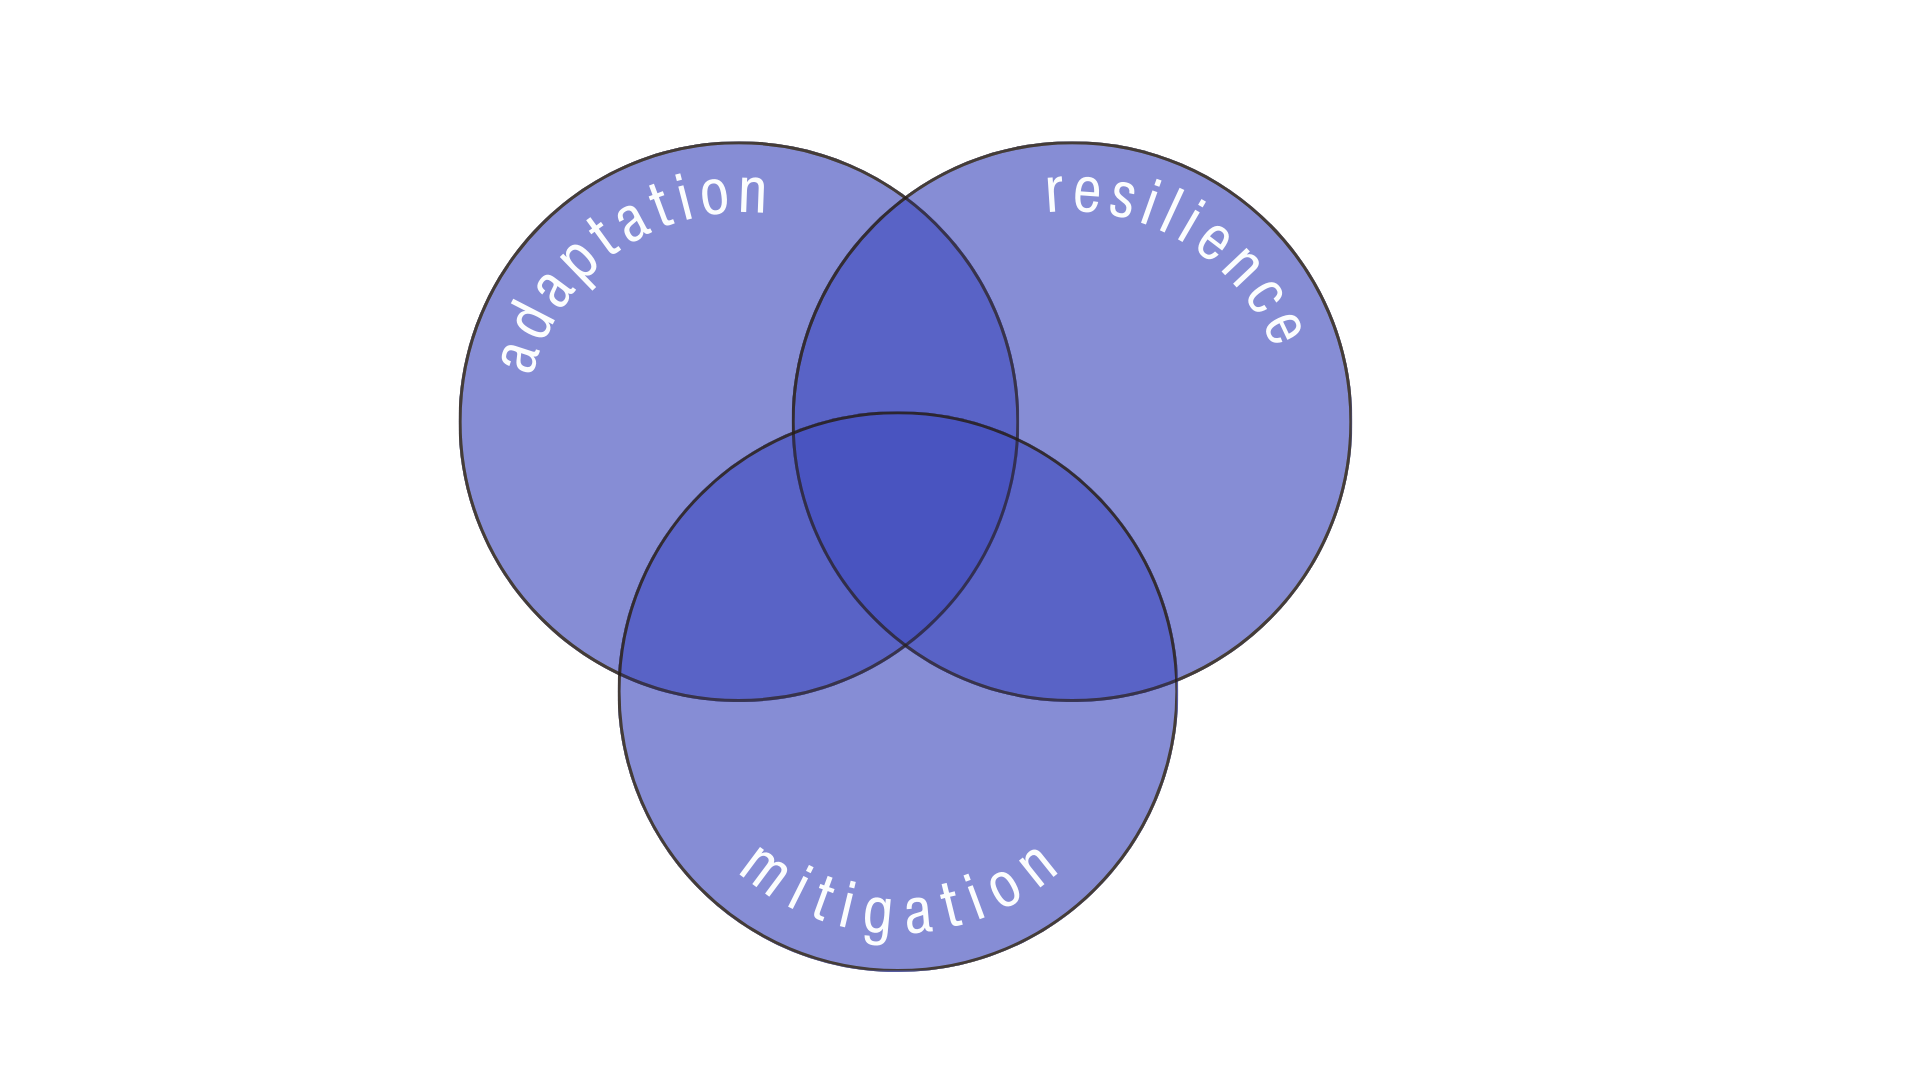
Figure 1. Overlaps needed for thorough sustainability and emergency climate plan. Source: Graphic by Author.
A major challenge institutions face is finding funding to support these initiatives. At a federal level, the Federal Emergency Management Agency (FEMA) is one of the largest sources of public aid following a disaster. The Agency provides grants to support mitigation efforts, manages emergency response personnel, and distributes financial resources to help individuals restore property after a disaster (FEMA). Arts and cultural funders are also developing avenues to support adaptation, mitigation, and resilience work, though these resources remain limited. The National Endowment for the Humanities and the Institute for Museum and Library Sciences have offered capital funding grants for adaptive infrastructure, but it is unclear how funding priorities will change under the new presidential administration (NEH, IMLS). This scarcity of resources forces cultural institutions to defer investment in facilities, with potentially serious consequences.
Current research on museum vulnerability to natural hazards takes an individualized approach, seeking primarily to understand the risks faced by a specific institution. This can be extremely beneficial for organizational decision-making, but may be limited by budget, expertise, and staff time to conduct such a study. Online hazard mapping tools are available to help an organization gain a general understanding of hazards that might impact their own space (Cooper, Hazard Risk Assessment Map). However, there is very little research about industry-wide trends in natural disaster risk, and particularly limited knowledge about how natural disasters may impact museums in climate justice communities.
Understanding Climate Justice
Climate justice literature points to the idea that not all communities experience the impacts of climate change equally. This theory emerged from the Civil Rights Movement and was further solidified by scholar Robert Bullard in response to public uproar about toxic waste dumping in predominantly Black neighborhoods in Houston (Borunda). This builds on other prominent political-ecological frameworks, like Benjamin Chavis’s Environmental Racism and Françoise d'Eaubonne’s Ecofeminism.
Current political-environmental scholarship is dominated by the theory of “intersectionality.” The concept, which originated from Dr. Kimberlé Crenshaw, describes how multiple systems of oppression can overlap and interact to develop complex systems of inequality (Oglesby). Building on this theory, activist Leah Thomas coined the term Intersectional Environmentalism in 2020, in the wake of the Black Lives Matter movement, accounting for the ways in which environmental activism overlaps with these systems of oppression (Oglesby).
Four key concepts emerge from this literature: distributive, procedural, recognitional, and restorative justice.

Figure 2. Core concepts feeding the intersectionality of justice: Source: CarbonDirect, Graphic by Author.
Climate Justice and Natural Hazard Risk
These Climate Justice principles are particularly important in considering how communities are impacted by natural disaster. Structural and socioeconomic inequalities such as gender, race, and disability exacerbate the consequences of natural disasters, and are often associated with lower levels of resilience and greater loss (UNDP).
Historic redlining and segregation practices built disparity into the. Under the New Deal, urban communities were scored by their desirability for the Home Owners Loan Corporation (HOLC) map to inform mortgage lenders (Los Angeles Almanac). This ranking, however, was overwhelmingly determined by race – viewing that a “homogenous” community was desirable, so long as it was white. “Infiltration” by Black, Asian, Native American, Latino, or Jewish individuals were given a “D” rating and outlined in red – hence the term “redlining.” This led to long term disinvestment in communities of color. Combined with restrictive racial covenants prevents non-white individuals from purchasing property in “desirable” neighborhoods, it reinforced racism and structural inequality.
This practice became illegal in the Fair Housing Act of 1968 and Community Reinvestment Act of 1977 - however, the impacts remain. Historically redlined communities often have less green space and tree coverage, which intensifies heat and challenges stormwater management.
These communities also have significantly fewer resources to aid in resilience initiatives, and they benefit less from the resources that are available. A 2018 study showed that, following natural disasters which created more than $10 billion in damages, Black individuals lost $27,000 in wealth, on average, while white residents gained $126,000 (Howell and Elliot, 2018). This is primarily attributed to disparity in property ownership, understanding that Black homeownership rate in the United States is at approximately 44%, compared to white homeownership at 72%. When FEMA resources are allocated to restore property through insurance payouts and low-interest loans, people who already own property benefit the most from these programs. However, there is limited assistance for non-homeowners who may be displaced, such as rental assistance programs. When compounded at a community level, this can intensify disinvestment in BIPOC communities.
Museums and Climate Justice
Museums have a complicated history with sustainable urban development. A 2022 study showed that museums tend to be located in clusters, often near medical or educational centers which favor more affluent, predominantly white communities (Greenberg, 2022). These institutions also bring in consistent public funding support, and they attract visitors who spend money at local businesses - further amplifying economic disparities and community investment over time.
To better understand this relationship as it relates to climate justice considerations of distributive, procedural, or recognitional justice, Greenberg also investigated these museum clusters relative to metrics, like pollution level, traffic, or proximity to superfund sites, finding that they often have more favorable environmental outcomes than the city at large (Greenberg, 2022). However, there is very limited industry knowledge about how museums are specifically impacted by natural disaster through the lens of climate justice.
One way to consider this is through the presence of culturally-specific, or identity-based museums. These are categorized by representing the history or culture of certain ethnic groups, for example, the National Museum of the American Indian, Asian Art Museum in San Francisco, or National Museum of African American History in D.C. The development of these institutions in the U.S. began to rise in the 1960s, serving an important role in preserving the cultural artifacts of historically underrepresented groups. We see these spaces serving cultural education roles, supporting resilience and restitution, and proactively working to secure rights within their communities (Bunning).
The cultural objects we preserve represent the stories we value. When cultural artifacts for marginalized groups are lost, it can further deepen divides in representation. A stronger understanding of this relationship between specific museum characteristics and natural hazard risk level, it may inform development of more equitable support networks for adaptation and resilience efforts. Therefore, this research seeks to better understand the impacts of natural hazards on museums, and how they may be systematically similar or different based on an institution’s type, size, and cultural identity.
Case Study: Los Angeles County, California
To address this question, a case study was conducted of Los Angeles County, California. Of course, following the tragic wildfires in January 2025, this region is top of mind for disaster preparedness and community resilience. Following the fires, concern grew in the arts community for the protection of the many collections housed in the county - not only in its many museums, but in the personal archives of artists and collectors who reside there.
This study area was selected through a few primary criteria. First, the county is at a high risk for natural hazards, having the highest FEMA Natural Hazard Risk Index score of any county in the United States (FEMA). The county also has a high concentration of museums - higher than any other U.S. metropolitan area (Hyperallergic). It is also one of the most arts vibrant counties in the United States, with an SMU Data Arts Vibrancy Score of 99.3, and is ranked first in the nation in Arts Providers (SMU Data Arts). This means that there is a large and diverse sample of museums for the purpose of analysis.
The county has 88 incorporated cities, with a diverse mix of urban, suburban, and rural landscapes. Each neighborhood has a unique character, which has been influenced by significant historic redlining and segregation. Great Los Angeles was one of many metropolitan regions mapped by HOLC in 1939, with lasting impacts on urban development and resource allocation.
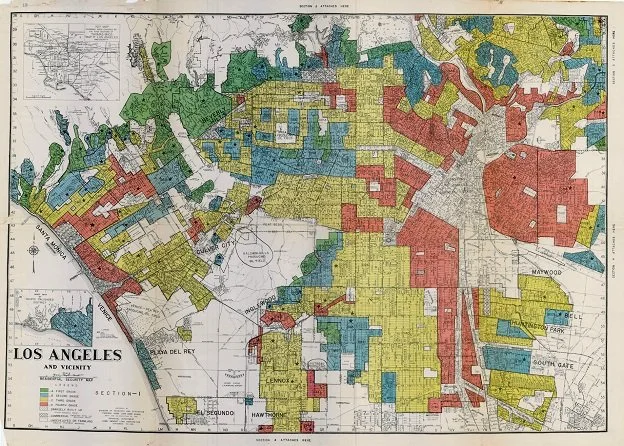
Figure 3. HOLC Map, Los Angeles - 1939 Source: Mapping Inequality - Redlining in New Deal America
Methodology
To further understand the relationship between museums, climate justice, and natural hazard risk, Los Angeles County museums were mapped relative to FEMA natural hazard risk levels. With this data, a quantitative analysis was conducted using linear regression and summary statistics to identify systematic similarities or differences in risk level by museum type, size, and culturally specific identity.
Museum Data
Museums were documented from the Institute of Museum and Library Sciences Museum Data Source, which aggregates museum data from other industry organizations, like the American Alliance of Museum, American Public Garden Association, Association of Science and Technology Centers, or similar. This data represented information from 2018, so each institution was checked to ensure that it is still in operation and that the address is accurate.
Next, additional institutional information was added to the data set from each institution, as available, including the 2022 Expenses, Assets, and Property and Equipment Value for organizations that qualify as a 501(c)3 non-profit. Culturally specific identity was determined through an analysis of each museum’s website and publicly available materials.
Type: As defined by IMLS Museum Data Files, this categorizes museums by the type of work they do. Categories include Art Museums, Botanical Gardens, Children’s Museums, History Museums, Natural History, Science & Technology Centers, and Zoos & Aquariums, and Uncategorized General Museums.
Size: This is defined by financial metrics, including budget, assets, and property and equipment value. This data was collected from the organization’s IRS Form 990 from Fiscal Year 2022, as available.
Culturally Specific Identity: If a museum self identifies as representing a specific culture or ethnic group, such as “African American History Museum” or “Asian American Museum of Art” it is considered a “culturally specific museum” for the purposes of this study.
The final data set included 196 museums, within 55 of the 88 incorporated cities in Los Angeles County. Eight museum types were represented in this dataset, including General (36.2%), Art (30.1%), History (12.2%), Botanical Gardens (8.7%) Science Centers (6.6%), Children’s Museums (2.6%), Natural History Museums (2.0%), and Zoos (1.5%). The dataset also includes 22 culturally specific museums, or approximately 11% of all institutions in the study. Museums cover a wide range of business structures, including nonprofits, small businesses, and city or university subsidiaries. 2022 Financial information is known for 93 museums, or 47% of all museums, and of these museums, annual expenses ranged from $2,686 to more than $344 million, with median annual expenses of $754,108. Total assets for fiscal year 2022 ranged from $30,994 to more than $12.5 billion, with median total assets of $3.2 million.
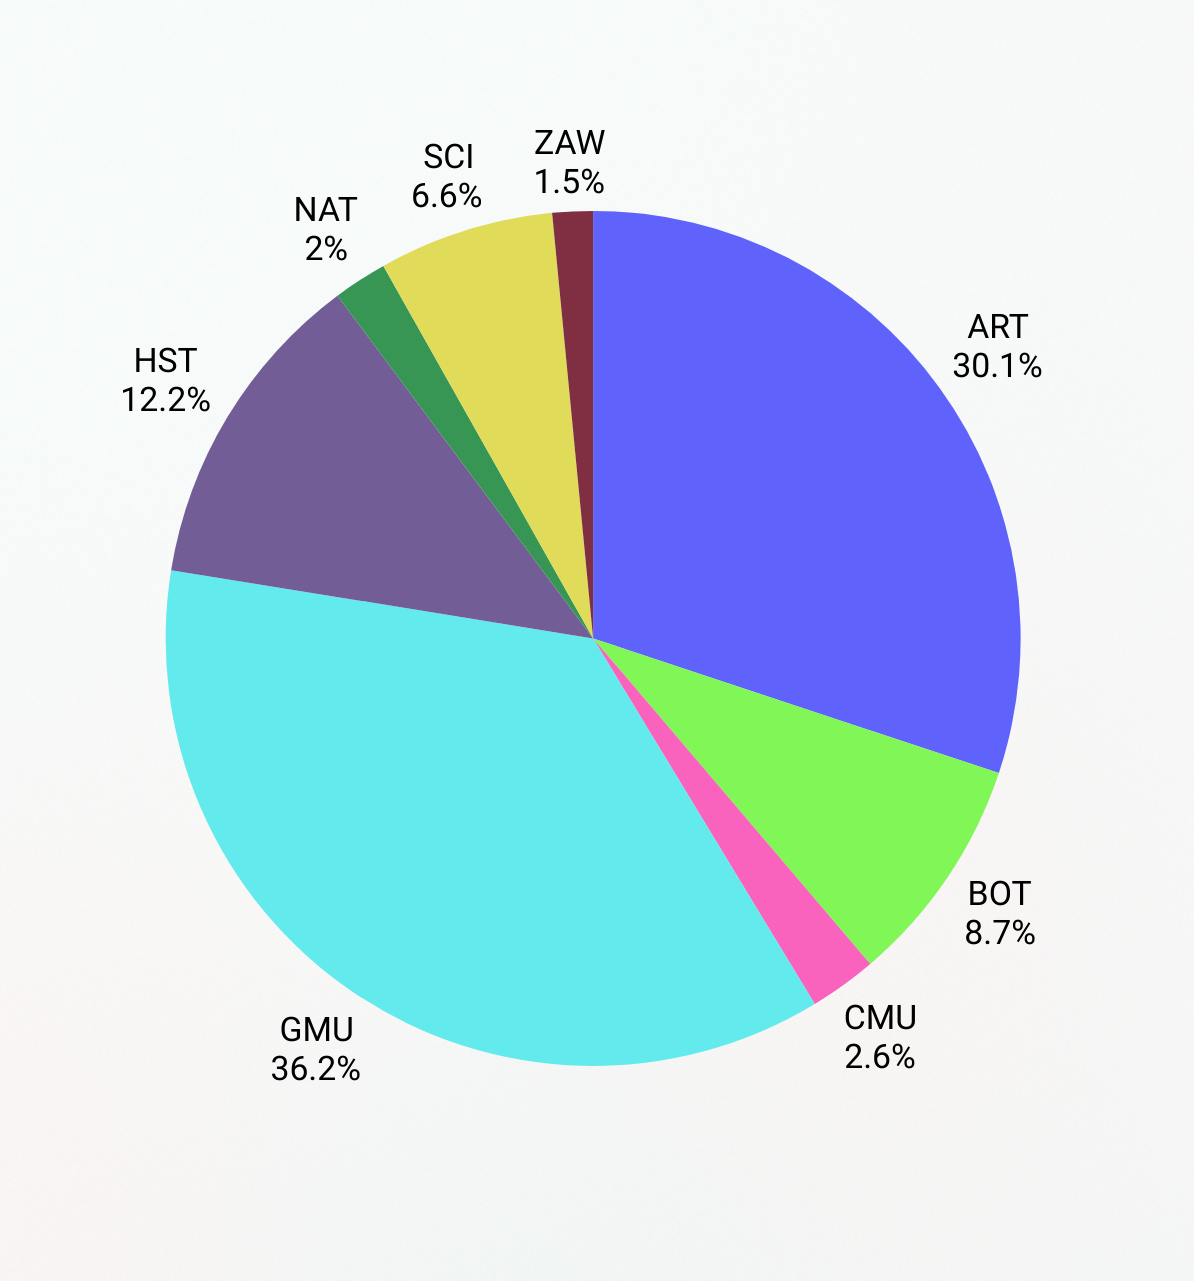
Figure 4. Distribution of Study Museums by Type. Source: Graphic by Author
Natural Hazard Risk Data
To gain a better understanding of risk, data was used from the FEMA Natural Hazard Index at a census tract level. A census tract is a geographical census measurement that breaks a county into smaller sections - each with a population between 2500 and 8000. The risk index is determined using three key measures: Annual Expected Loss, Social Vulnerability, and Community resilience, as defined below.
Annual Expected Loss: Estimated economic loss per year, compared to communities at similar level. A high expected loss score correlates with a high overall Risk Index Score.
Social Vulnerability: The disproportionate loss or death to a community, compared to communities at a similar level. This is determined from data on socioeconomic status, household characteristics, racial and ethnic status, and transportation and housing. A high social vulnerability score correlates with a high overall Risk Index Score.
Community Resilience: A community’s ability to prepare for and recover from a disaster. A high community resilience score correlates with a low overall Risk Index Score.
Using this data, a geographic analysis was conducted using ArcGIS. First, census tract level natural hazard risk data was mapped for Los Angeles County. Museums were mapped over this data to visualize potential trends. The census tract level hazard risk data was joined to each museum to export for further analysis. Additional visualizations were created, mapping organizations by unique type, cultural identity, and budget level to conduct a visual analysis. To gain a better understanding of trends, data was further analyzed by city, and within the City of Los Angeles, by neighborhood.
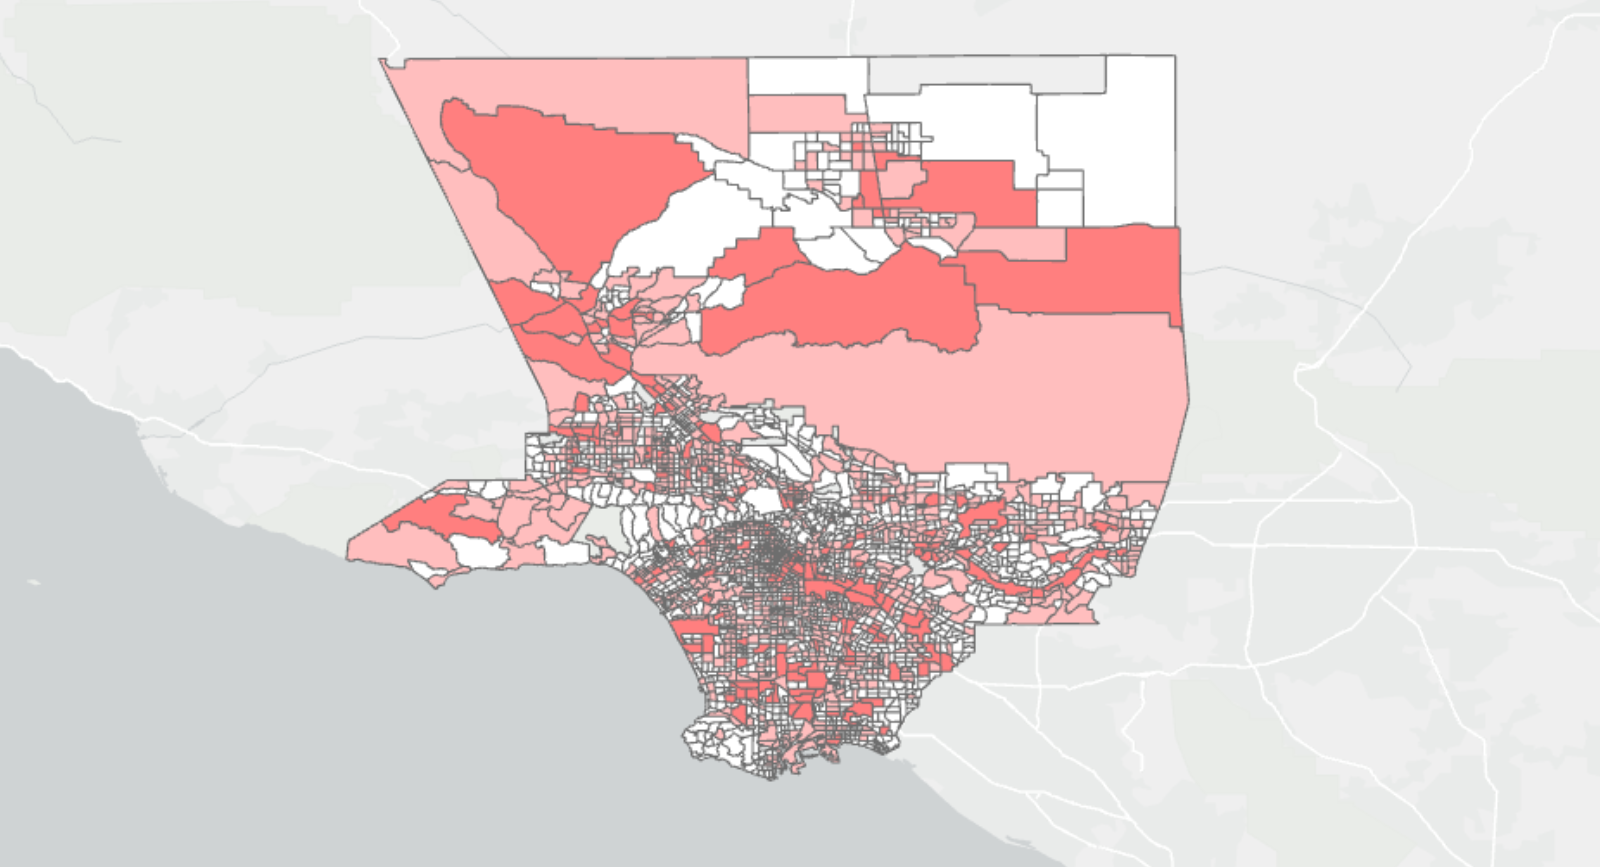
Figure 5. FEMA Natural Hazard Risk By Census Tract in Los Angeles County, California. “High Risk” is represented in dark red, while “Relatively High” is represented in light red. Source: Graphic by Author.
Findings
Overall, 70.4% of museums in Los Angeles County were located in census tracts at a high or very high natural hazard risk level. The largest portion of museums in Los Angeles County are located in the City of Los Angeles, at 65 institutions (34%), Pasadena at 13 institutions (7%), and Claremont at 11 institutions (6%). In the City of Los Angeles, the largest portion of museums are in Hollywood at 13 institutions (7%), Wilshire at 10 Institutions (5%) and Westwood at 9 Institutions (5%).
Organization Type
Botanical Gardens, Zoos, and Children’s Museums had slightly lower average risk level than other museum types, at 79.2, 79.9 and 70.5 respectively. Conversely, Art (88.9), Science (89.5), General (89.5), and Natural History (88.8) museums have the highest average risk scores This may be attributed to difference in land and water requirements for these types of institutions - as Zoos and Botanical Gardens are often located outside of urban centers, with more green space and tree coverage. This can effectively reduce the severity of extreme heat or drought.

Figure 6. Museums, by type, over FEMA Natural Hazard Risk by Census Tract in Los Angeles County. Source: Graphic by Author.
Similarly, average annual expected loss follows the same trend. Botanical Gardens and Zoos are located in less dense areas, and inherently experience less economic impact from natural hazards than more urban counterparts. Though Children’s Museums generally do not have specific land requirements, Los Angeles’s Children’s Museums are located in Sylmar, Pasadena, Brentwood, and Santa Monica - communities with less population density, each experiencing some level of gentrification.
Looking at social vulnerability scores, General and History Museums are at the highest risk, at 63.5 and 57.1 respectively. This means that they are located in communities that may have high levels of poverty or unemployment, large populations of seniors or young children, large numbers of multi-unit housing structures, limited transportation access, or other factors that correlate with more significant harm when a natural hazard occurs. Children’s Museums and Botanical Gardens have the lowest average social vulnerability risk, at 33.6 and 37.9.
Culturally Specific Identity
Culturally specific museums in the study were located Downtown (3), Long Beach (2), South Los Angeles (2), West Adams (2), Wilshire (2), and West Los Angeles (2). Culturally specific museums had 2022 Annual Expenses ranging from $2,686 to more than $27.5 million, with a median annual budget of approximately $1.2 million. These institutions represented a variety of cultures, with the largest number of culturally-specific museums sharing African American (4), Jewish (4), Japanese American (3) and Armenian (2) stories.
They also represent a variety of museum types - most are General museums (12), though others fall into the category of Art (3), History (3), Botanical Garden (3), and even one Children’s Museum.
While overall Risk Score was similar among culturally specific (88.8) and non-culturally specific museums (86.7), However, the average Social Vulnerability rating was significantly higher for culturally specific museums than non-culturally specific museums, at 72.3 and 50.3 respectively.
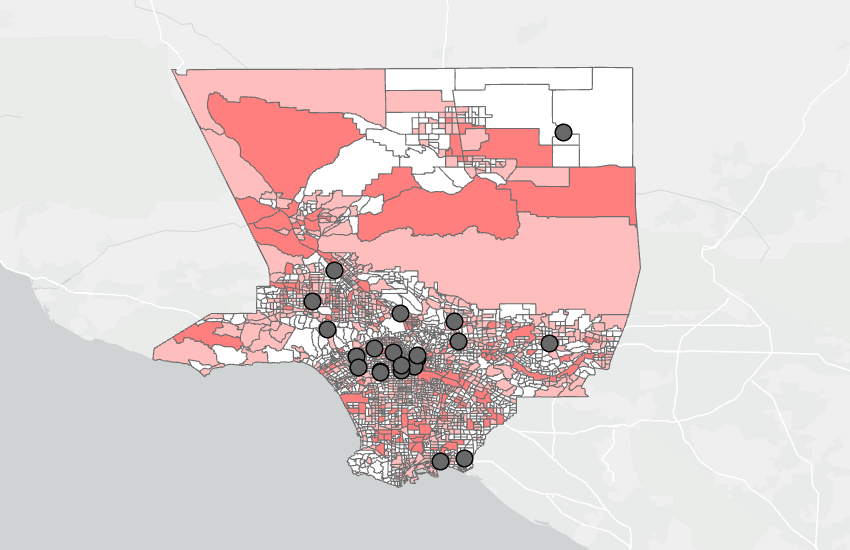
Figure 7. Culturally Specific Museums over FEMA Natural Hazard Risk by Census Tract in Los Angeles County. Source: Graphic by Author.
Budget
Using a simple linear regression, there does not appear to be a correlation between budget size and natural hazard risk level. Due to the limitations of publicly available data, financial information was only available for institutions that qualify as a 501(c)3 non-profit, and have gross receipts above 50,000. This means that institutions with the smallest budgets are likely not represented in this data. Further analysis may be needed to better understand this relationship, if present.


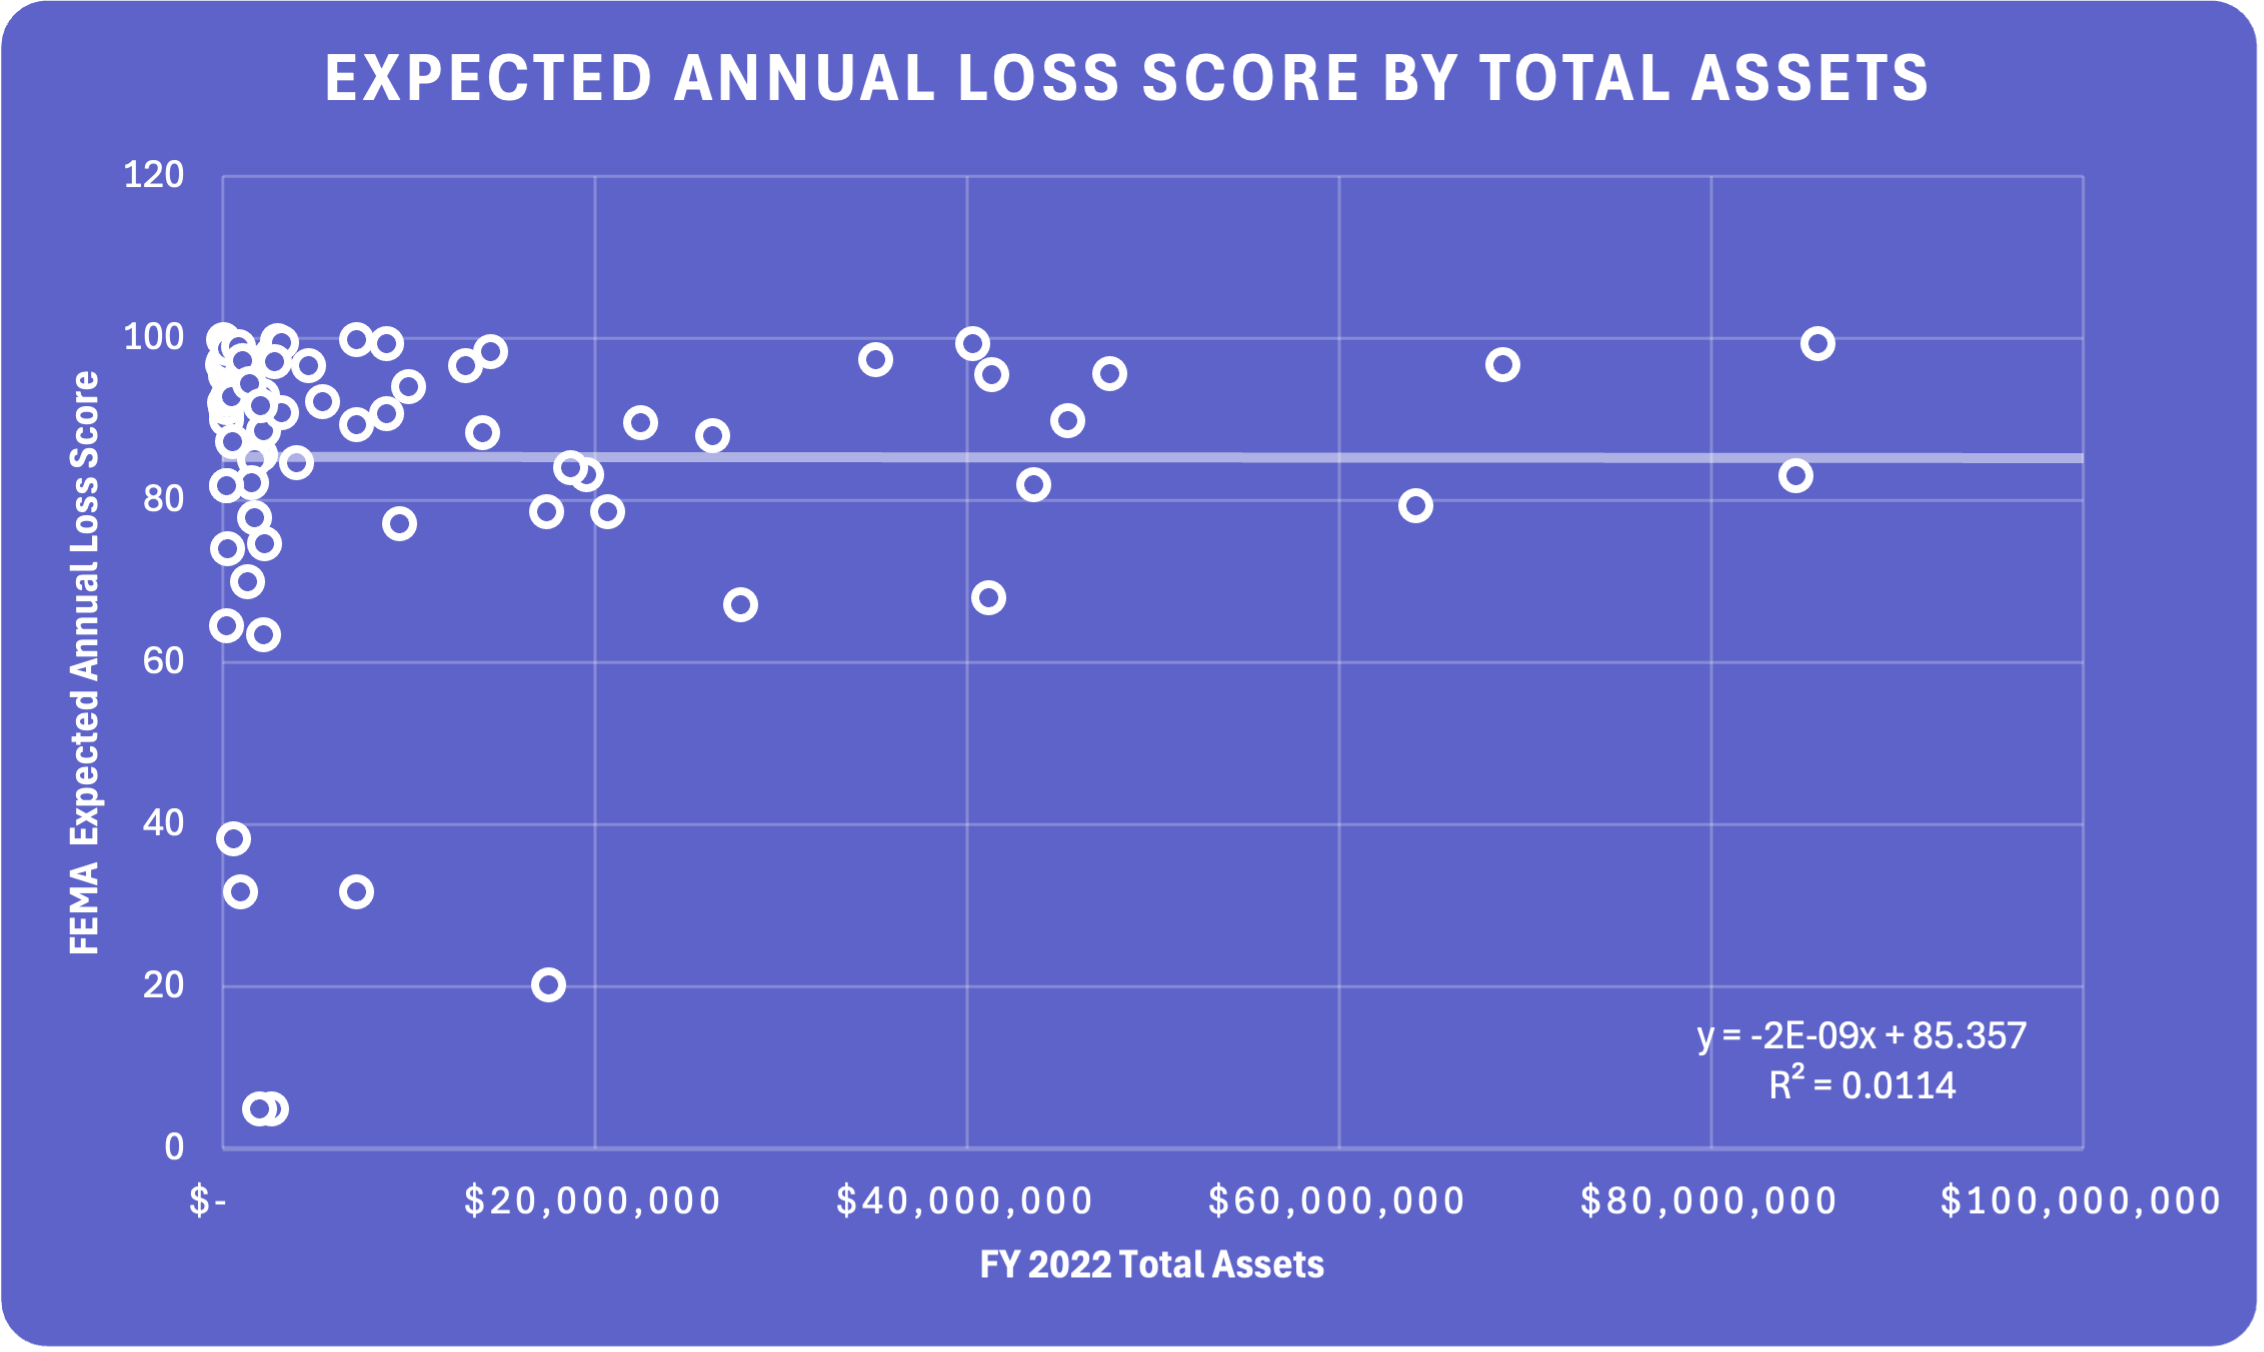


Figure 8. Analysis of Budget and Assets by Natural Hazard Risk Scores. Source: Graphics by Author.
CONCLUSION
Culturally specific museums in Los Angeles County have higher levels of social vulnerability to natural hazards than other museums, though expected annual loss is consistent among all types. Likely, this is because these culturally-specific museums were built in the communities that they represent. Considering historic exclusion from resources through practices like redlining, these communities are highly vulnerable to natural hazards, even if they are no more likely to see a natural disaster than a neighboring community - the impacts can be drastically different.
Considering how risk varies by organization type, Los Angeles Botanical Gardens, Childrens Museums, and Zoos experience lower overall risk than counterparts. This variance may be dependent on the types of hazards a region is most susceptible to. Future research on this topic could investigate these trends by looking solely at proximity to historic or projected hazards, considering how various hazards may impact different types of institutions.
Overall, geospatial analysis of natural hazards relative to museums can be highly effective in disaster preparedness initiatives. However, one must proceed cautiously in using these tools for decision making and resource allocation. Recalling how redlining emerged by mapping risk with an emphasis on racial disparities - it is important to consider how mapping natural hazard level and social vulnerability may unintentionally recreate harms of disinvestment when used irresponsibly.
This understanding of risk must be used to more equitably distribute resources, prioritizing those which have most negatively impacted and excluded from decision making. Museum’s and funders must use mapping as a tool to address disparity in resource allocation - not write off communities at risk.
-
American Alliance of Museums. “National Preparedness Month and Museums,” September 3, 2024. https://www.aam-us.org/programs/months/national-preparedness-month/.
American Alliance of Museums. “TrendsWatch: Museums as Community Infrastructure (2022),” March 18, 2022. https://www.aam-us.org/programs/trendswatch/trendswatch-museums-as-comunity-infrastructure-2022/.
Bahney, Anna. “Homeownership Gap between Black and White Owners Is Worse Now than a Decade Ago | CNN Business.” CNN, February 20, 2024. https://www.cnn.com/2024/02/20/economy/black-white-homeownership-gap/index.html.
Borunda, Alejandra. “The origins of environmental justice—and why it’s finally getting the attention it deserves” National Geographic, February 24, 2021. https://www.nationalgeographic.com/environment/article/environmental-justice-origins-why-finally-getting-the-attention-it-deserves
Bunning, Katherine L. “Reframing ’culturally Specific Museums’ : The Emergence of Rights-Based Museums in the United States.” Ph.D., University of Leicester (United Kingdom), 2019. https://www.proquest.com/docview/2307399916?pq-origsite=primo&_oafollow=false&sourcetype=Dissertations%20&%20Theses
Canesi, Linda, Alessandro Sardella, Rainer Vogler, Anna Kaiser, Carmela Vaccaro, and Alessandra Bonazza. 2024. "Hazard Analysis and Vulnerability Assessment of Cultural Landscapes Exposed to Climate Change-Related Extreme Events: A Case Study of Wachau (Austria)" Heritage 7, no. 4: 1917-1934. https://doi.org/10.3390/heritage7040091
“Climate change is a matter of justice – here’s why” UNDP. June 30, 2023. https://climatepromise.undp.org/news-and-stories/climate-change-matter-justice-heres-why
“Climate Smart Humanities Organizations” National Endowment for the Humanities. Accessed February 13, 2025. https://www.neh.gov/program/climate-smart-humanities-organizations-0
Cooper, Madeline. “Mapping and the future of caring for the past: Using GIS as a tool to understand the risk of emergencies to cultural heritage collections.” Institute for Parks, People,and Biodiversity. University of California, Berkeley, 2022. https://parks.berkeley.edu/psf/wp-content/uploads/2022/09/psf_383_cooper_web.pdf
“Deadly Maui Wildfires Have Destroyed Museums, Heritage Sites, and Scores of Cultural Artifacts.” Artnet News. August 23, 2023. https://news.artnet.com/art-world/maui-wildfires-destroyed-museums-heritage-sites-cultural-artifacts-2353178
“Disaster Readiness & Recovery for the Arts and Culture Sector.” Accessed January 29, 2025. https://www.arts.gov/impact/disaster-readiness-recovery-for-the-arts-and-culture-sector.
“Disaster Report.” Accessed February 12, 2025. https://sites.google.com/g.uky.edu/arts-disaster-crisis/disaster-report.
“Distributive Justice.” Science Direct. https://www-sciencedirect-com.cmu.idm.oclc.org/topics/social-sciences/distributive-justic
Greenberg, Michael. “Museums, the Building of Wealth Clusters and Soft Power.” In Environmental & Social Justice Challenges Near America’s Most Popular Museums, Parks, Zoos & Other Heritage Attractions, edited by Michael Greenberg, 127–47. Cham: Springer International Publishing, 2022. https://doi.org/10.1007/978-3-031-08183-5_7.
e“How can I protect the cultural resources I care about?” Climate Resilience Resources for Cultural Heritage. Accessed February 5, 2025. https://www.resilience.culturalheritage.org/
“IMLS Awards Over $3M in Grant Funding through Museums Empowered Program.” Institute of Museum and Library Sciences, August 6, 2024.https://www.imls.gov/news/imls-awards-over-3m-grant-funding-through-museums-empowered-program
“Mapping Inequality.” Accessed March 28, 2025. https://dsl.richmond.edu/panorama/redlining/.
“Mitigation, Adaptation and Resilience: What’s the Difference? | DLA Piper.” Accessed April 14, 2025. https://www.dlapiper.com/en-us/insights/topics/cop-conference-of-the-parties/mitigation-adaptation-and-resilience.
“Museum Data Files.” Accessed February 1, 2025. http://www.imls.gov/research-evaluation/data-collection/museum-data-files.
National Coalition for Arts Preparedness and Emergency Response. “Field Guide.” Accessed January 29, 2025. https://www.ncaper.org/ncaperfieldguide.
National Endowment for the Humanities. “National Endowment for the Humanities and Cultural Preservation After Hurricane Katrina.” Accessed February 3, 2025. https://www.neh.gov/news/national-endowment-the-humanities-and-cultural-preservation-after-hurricane-katrina.
Oglesby, Cameron. “The generational rift over 'intersectional environmentalism.’” Grist, February 10, 2021. https://grist.org/justice/intersectional-environmentalism-justice-language/
“Redlining in Los Angeles County.” Accessed April 10, 2025. https://www.laalmanac.com/history/hi727.php.
Roche, Elisse. “What is Environmental Justice?” Carbon Direct. August 3, 2023. https://www.carbon-direct.com/insights/what-is-environmental-justice
Stevens, Matt. “Palisades Fire Could Test Getty Center’s Efforts to Protect Its Art Collection.” New York Times, January 11, 2025. https://www.nytimes.com/2025/01/11/us/getty-center-museum-pacific-palisades-fire.html
Stromberg, Matt. “The Secret Life of LA’s Small Museums.” Hyperallergic, March 19, 2025. http://hyperallergic.com/997185/the-secret-life-of-los-angeles-small-museums-todd-lerew/.
The Art Newspaper - International art news and events. “Deadly Wildfires Destroy Los Angeles Art Spaces as Museums and Galleries Close,” January 9, 2025.
“The Top 40 Most Arts-Vibrant Communities of 2024” SMU Data Arts. Accessed March 20, 2025. https://culturaldata.org/arts-vibrancy-2024/the-top-40-list/#LosAngeles
“What Is Environmental Justice? | Carbon Direct.” Accessed March 2, 2025. https://www.carbon-direct.com/insights/what-is-environmental-justice.