

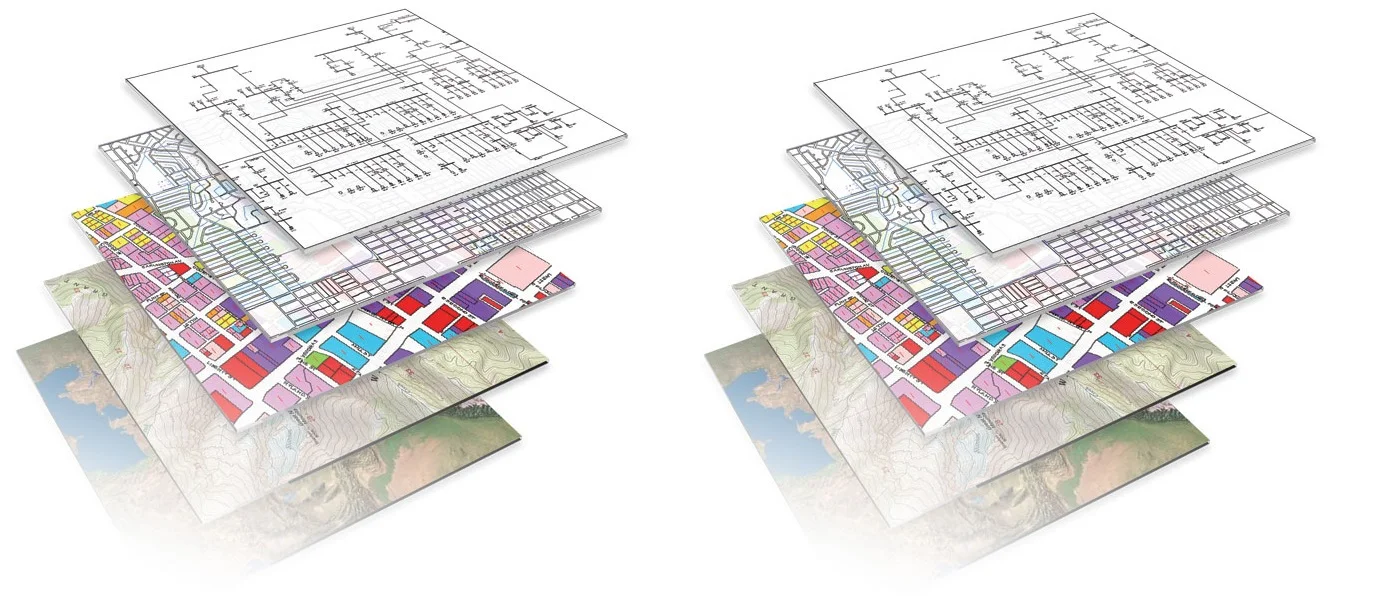
Source: Prince William County, Virginia http://bit.ly/HVfm3F
Data-driven decision making is, not surprisingly, limited by what data are available. When working with spatial information, that data includes geography. Like Photoshop or Illustrator, GIS software builds maps from layers, and the first layers needed are particular to geography: political boundaries, water features, school districts, and streets, for example. The United States Census Bureau offers a nationwide database of these features, called TIGER/Line® Shapefiles, which can be manipulated to focus on a particular area of interest. These Shapefiles can be polygons, lines, or points, and have geographic entity codes (GEOIDs). They do not include demographic information themselves, but can be linked to Census demographic data, which also uses GEOIDs.[i][ii] Data tables from other sources can be joined to the Shapefiles using various methods depending on the available parameters, most commonly by zip code or street address.
Even if your organization is not planning on doing this analysis itself, it is necessary to know what types of questions can be answered using GIS technology before assigning the task to someone else. Questions will be defined by the scope of a particular project, and most importantly, by what data are available. Once a particular project is decided upon, next ask:
- What data do I want?
- Where will I get it from?
In this update I will provide examples of different data sources that are generally needed by, and relevant to, arts organizations.
1. Decennial Census and American Community Survey (U.S Census Bureau)
http://factfinder2.census.gov
The smallest unit for which the U.S. Census Bureau publishes data are blocks (mostly city blocks), then wider areas like block groups, census tracts (larger block groups within a county, used for statistical purposes[iii]), counties, states, divisions (eg. Middle Atlantic), region (eg. Northeast) and finally the whole nation.[iv] [v]Data from the decennial census, as well as 1, 3, and 5 year estimates from the American Community Survey, are available for download without charge in the American Fact Finder.[vi] Most variables are available at the block group level and higher; limited data are provided at the block level for public use, however, to protect privacy. Below are some examples of variables collected by the Census Bureau, divided in three categories:
- People: age and sex, disability, education, employment, language, poverty, race and ethnicity
- Housing: housing units, financial characteristics and occupancy characteristic
- Businesses: business characteristic (including tax status), business owner (age, educational attainment), economic series (industry)
How might these be relevant to an arts organization? Consider a museum evaluating whether or not to program a travelling exhibition featuring work by Latino/Chicano artists. After assessing the aesthetic qualities and overall relevancy of the exhibition, they might want to analyze if a connection exists between the theme of the exhibition and their audience. The answer to this question would probably be different in Houston than in Pittsburgh, and even between neighborhoods in a city. This is where GIS analysis starts to become useful.
2. Other Federal Agencies – National Center for Education Statistics (NCES)
http://nces.ed.gov/
The NCES provides information about colleges, public and private schools, and libraries. In this website you can refine the search to target very specific pieces of information. For example, in a recent search I found all colleges in Pennsylvania that offer Bachelor’s or advanced degrees in arts management (twelve). Results can then be exported as an Excel table; in the Pennsylvania colleges example, my results included the following fields: school name, address, website, type of school, awards offered, type of campus setting, campus housing (yes/no), student population, number of undergraduate students, graduation rate, transfer-out rate, cohort year, and net price.
Education is a vital part of most arts organization’s mission. Understanding the educational attainment and specialization areas of our audiences helps us design better programs, and knowing what other opportunities are offered by local or regional institutions can help to determine the need of a new program, or the importance of developing a new grant.
3. Local Agencies – City of New York
As cities embrace open data efforts and make datasets available for general use, information about specific municipalities is increasingly available. However, the amount of local data available varies greatly from city to city, so the best way of determining what is available for a specific location is to visit the local government website.
To illustrate this point, consider the City of New York. The local government developed NYC Open Data, a searchable repository of data produced by different entities of the city’s government. On a recent search, I was able to locate a listing of all cultural institutions in the Department of Cultural Affairs (DCLA) directory[vii]. The exported Excel file contained information about 1,651 different organizations with columns tracking organization name, address, city, zip code, main phone number, discipline, council district, community board, and borough.
This dataset is useful to arts organizations that are trying to determine partnership opportunities. Additionally, many arts organizations have similar spreadsheets for internal use. With a little cleaning up in Excel, those spreadsheets can also be incorporated into GIS.
As I continued to research how arts organizations can use spatial data to advance their programming missions, and looked at the volume of data already available, numerous scenarios come to mind. Spatial data can be used to evaluate a traveling exhibition proposal or a public art site, develop a grant-making or educational program, or identify potential partnerships. The byproduct of all of these scenarios is that data-driven decisions enable organizations to make strong cases, especially when they’re looking for funding. If those cases can be conveyed through a map, better yet.
If the goal of having more efficient programs and a better chance at funding by using GIS interests you, I would love to hear your ideas below. If it doesn’t seem relevant, please also leave any questions or comments, as your feedback will help guide the course of this research. Thanks!
[i] http://www.census.gov/geo/maps-data/data/tiger-line.html
[ii] http://spatial.scholarslab.org/stepbystep/joining-census-data-tables-to-shapefiles-in-arcmap/
[iii] http://www.census.gov/geo/reference/gtc/gtc_ct.html
[iv] http://www.census.gov/geo/reference/pdfs/geodiagram.pdf
[v] http://www.caliper.com/maptitude/census2000data/summarylevels.htm
[vi] http://www.census.gov/acs/www/Downloads/handbooks/ACSTeacherHandbook.pdf
[vii] https://data.cityofnewyork.us/Recreation/DCLA-Cultural-Organizations/u35m-9t32