

What is digital inequity?
Digital inequity is an issue underscored by the onset of the COVID-19 pandemic. In their Fourteenth Broadband Deployment Report, the FCC found that at the end of 2019, roughly 14.5 million Americans were living in areas without access to high-speed broadband. That same report found that nearly 83% of Americans in rural areas lack access to this speed. Access, however, is just one barrier to digital equity. The other top barriers as defined by the National Digital Inclusion Alliance are affordability and literacy. These barriers are becoming increasingly pronounced as the world progresses into a digital age. Many sectors, including the arts and culture, are adapting to a digital landscape, making digital equity issues unavoidable. An NEA report titled Tech as Art: Supporting Artists Who Use Technology as a Creative Medium found that tech-centered artists are in a position to partner with policymakers, educators, and other arts practitioners to take on larger societal issues, particularly issues of equity and inclusion. In a complementary essay to this report, Agnes Chavez posited that new media artists have the potential to bridge the digital divide through increasing digital literacy, access, and advocacy for the widespread adoption of STEAM education.
Many U.S. cities are implementing digital equity plans while others lag behind or struggle to make progress. Several cities with both favorable and unfavorable ratings for digital equity appear in SMU DataArts’s Top 40 Arts-Vibrant Communities of 2022. The release of this report sparked some technology curiosity to explore if these cities’ arts vibrancy translated to being more equitable in other areas, such as digital connectivity. In the wake of the pandemic, many arts organizations and artists took to online or hybrid programming to stay connected to audiences. Many have retained some form of digital programming to provide access for communities who otherwise experience barriers to entry. But as the digital divide becomes more of an inescapable consideration for digital events, it begs the question of how equitable digital engagement efforts really are. Thus, the following research questions were developed:
In the top 40 arts-vibrant cities in the U.S. of 2022, where does their level of digital equity fall in relation to their arts vibrancy score?
In cities where new media and digital arts are prevalent, where does their level of digital equity fall in relation to engagement in this art medium?
How does digital inequity correlate with arts participation?
How, if at all, are arts organizations filling digital equity gaps in their communities?
This article reports on the findings answering question 1 of that list. The goals for this round of research are 1.) to better understand the relationship between digital inequity and the arts and culture sector and 2.) to begin to show the relevance of each area within the other - that is, how does digital inequity impact the arts sector and how might the arts sector respond to the digital inequities in their communities? This research was compiled under the belief that the arts can have a role in combatting issues of equity and inclusion outside the field of arts and culture. The arts’ role in the broader public sphere can improve the lives of all members of a community. The hope for this research is to begin to understand how that can begin to take shape to address digital inequity. At the end of this article, case studies demonstrate how specific artistically vibrant cities can still have disparate digital accessibility and literacy.
methodology
Definitions
The following terms are defined as they were in their original sources.
Digital Equity: a condition in which all individuals and communities have the information technology capacity needed for full participation in our society, democracy, and economy.
Digital Divide: the gap between those who have affordable access, skills, and support to effectively engage online and those who do not.
Digital Inclusion: the activities necessary to ensure that all individuals and communities, including the most disadvantaged, have access to and use of Information and Communication Technologies (ICTs).
Broadband/broadband speed: the FCC’s current benchmark for adequate broadband speed.
Metric: (in this context) Arts Vibrancy, Arts Dollars, and Government Support of any city as established by SMU DataArts.
Arts Vibrancy: a score determined by supply, demand, and public support for arts and culture in an area, along with the application of Merriam-Webster’s definition of the word to mean “pulsating with life, vigor, or activity.”
Arts Dollars: “a gauge of demand for nonprofit arts and cultural programming, including earned revenue from program activities, contributed revenue supporting the arts, total compensation to artists and staff, and total expenses.”
Arts Providers: “a gauge of supply and include the number of independent artists, arts and culture employees, nonprofit arts and cultural organizations, and arts, culture, and entertainment firms in the community.”
Government Support: “a gauge of public support for arts and culture, captured as the number of state and federal grants and total government grant dollars in the community.”
MSA: communities in SMU’s report defined by the Office of Management and Budget as Micro- and Metropolitan Statistical Areas. Metropolitan Statistical Areas have “at least one urbanized area of 50,000 or more population.” Micropolitan Statistical Areas have “at least one urban cluster of at least 10,000 but less than 50,000 population.”
smu dataarts arts vibrancy ranking
Arts Vibrancy is calculated under the assumption that arts organizations are tied into the social fabric of their communities. SMU calls the relationship between arts organizations and their communities “symbiotic”. Figure 1 depicts the interdependent relationship in which an arts ecosystem flourishes.
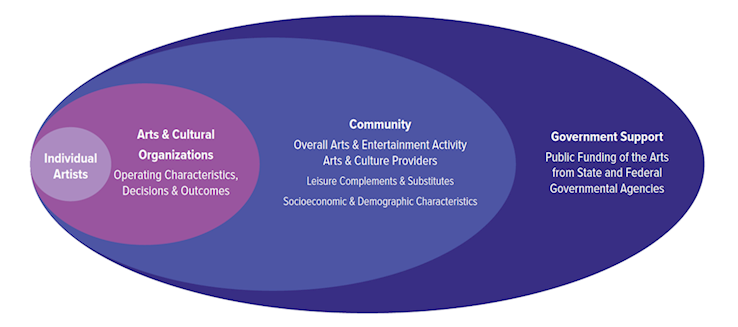
Fig. 1. Source: SMU DataArts
SMU’s method involves geolocating organizations and linking them to their community’s characteristics in the data. Three metrics for which data from these organizations is collected are used for any given MSA. For each metric, 4 different measures are calculated. Each metric also has a weight that contributes to the overall ranking in the final calculation. The metrics and their respective measures are as follows:
Arts Providers (45%):
Independent artists
Arts and culture employees
Arts and cultural organizations
Arts, culture & entertainment firms
Arts Dollars (45%):
Program revenue
Contributed revenue
Total expenses
Total compensation
Government Support (10%):
State arts dollars
State arts grants
Federal arts dollars
Federal arts grants
MSAs receive a ranking based on ordinal measurement, which ranks data and doesn't account for the distance between data points. SMU underscores this with the pronouncement that “the overall arts vibrancy ranking is not an average of the rankings on the three component metrics and the three component metrics are not an average of the rankings on their underlying measures.”
Below is an excerpt from SMU’s report on how Arts Vibrancy scores are calculated through a process of standardization and factor analysis:
“To combine measures for score calculations, we standardize each metric using factor analysis. The factor analysis process applies weights to the measures based on the calculated “quality” of each measure. The weighted measures are then combined to create a standardized factor score for each of the metrics. The standardized scores have means of zero and standard deviations of one. Once the three metrics are standardized, we weight them 45% for Arts Providers, 45% for Arts Dollars, and 10% for Government Support. These weighted metrics are then added to generate the Arts Vibrancy score for a particular community. Arts Vibrancy scores for all communities are then compared to determine Top Arts-Vibrant Communities and allow for the generation of percentile-like scores as shown on the Arts Vibrancy Map.”
The final rankings are summarized in a map, shown in Figure 2. SMU DataArts published an accompanying Arts Vibrancy Map along with the report, which shows the rankings of various arts vibrancy indicators across all U.S. counties.
digital inequity ranking
Using the Microsoft Airband Initiative’s digital equity dashboard, six factors were chosen to measure against SMU’s list of arts-vibrant cities.
Percent of high schools without a foundational Computer Science course
Households without a desktop or laptop
Percent without access to broadband of any type
Percent of people not using the internet at broadband speed
Percent without an internet subscription to broadband of any type
Percent without a broadband subscription in households making under $20,000 annually
These factors primarily focus on access to broadband, desktop or laptop computers, adequate broadband speed, and secondarily on education, in terms of high school computer science courses available. Affordability was not taken into account when deciding on these factors because it can be assumed that if there is low digital access, there is low affordability. A data point of each factor was taken of the county(ies) each MSA resides in, not the individual cities because of unavailable data. If an MSA resided in multiple counties, the average of the total number of counties was taken.
Figure 3 presents a summary of ranges, including outliers, for each factor. After data collection, the mean, standard deviation, and z-scores were calculated. Using the standard convention for interpreting z-scores, anything above 1 or below -1 was looked at further.
Combining these data sets, a separate Excel spreadsheet, shown in Figure 4, was created listing each MSA in its own row and each digital equity category in a column. Conditional formatting was used to highlight z-scores using a Green-Yellow-Red color scale, with green indicating lower levels of inequity and red indicating higher levels of inequity. Note that a higher z-score indicates higher levels of inequity, a lower z-score indicates lower levels of inequity, and 0 indicates the average among MSAs. It is also important to recognize that this comparison was done only in the MSAs listed by SMU DataArts. Because an area has a lower z-score does not necessarily mean it is less equitable than the national average. This falls outside the scope of this research, but any statistics listed may be better or worse than the national average. In this analysis, a total sample size of 40 was used.
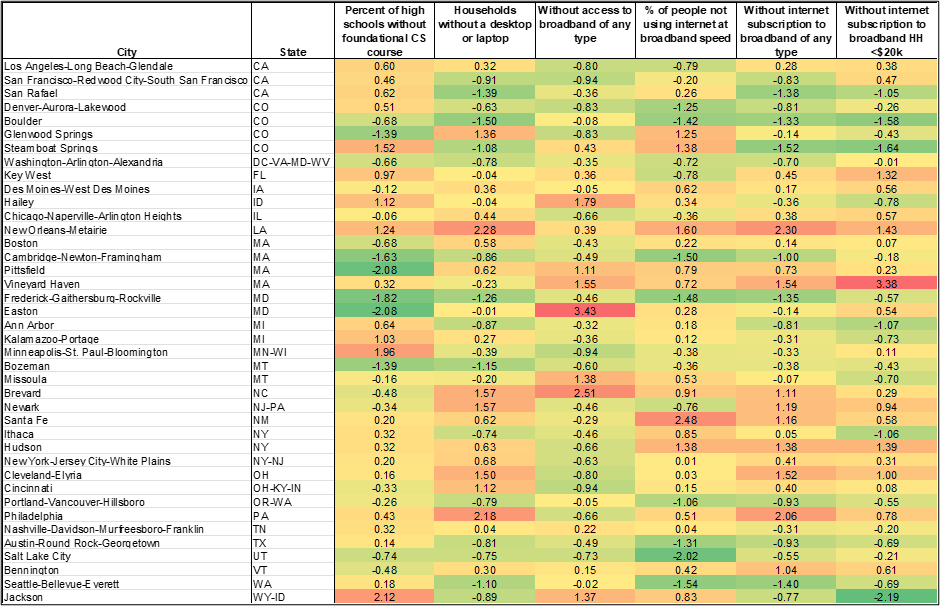
Fig. 4
Other sources of data collection include the National Digital Inclusion Alliance’s State Digital Equity Scorecard and Centri Tech Foundation’s Digital Advancement Municipal Index. The State Digital Equity Scoreboard was used to compile states’ digital equity scores to compare them to their respective MSAs. These scores were determined by six sub-indicators. Scores fall on a 0 to 6 scale, with 6 being the best possible score, indicating a high level of digital equity. The Digital Advancement Municipal Index was used to further examine individual cities that were of particular interest after analysis. But because not all MSAs’ data on that platform was available, it was minimally consulted.
findings
state digital equity scores
Of the 26 states represented in SMU’s Top 40 list (excluding Washington D.C.), Washington scored the highest while Montana scored the lowest. Figure 5 displays the top highest and lowest-scoring states.
As data analysis was conducted, there were some discrepancies that appeared between state digital equity scores and those of MSAs. Colorado, for example, has a digital equity score of 5.2. Yet the arts vibrant cities in SMU’s findings, Glenwood Springs, Steamboat Springs, Boulder, and Denver-Aurora-Lakewood, had varying degrees of digital equity across the categories explored.
MSA digital equity standings
None of SMU’s metrics were found to have a correlation with any of the digital inequity factors. At the start of this research, it was not predicted that anything would be directly connected. There are numerous instances in the data where this was found to be the case. For example, Los Angeles-Long Beach-Glendale, CA has the lowest ranking of Government Support on the list (259th), and its level of equity regarding households without a desktop or a laptop is relatively average. Other cities with much higher rankings of Government Support scored much lower in the same category, such as New Orleans-Metairie, LA, and New York-Jersey City-White Plains, NY. Relationships between two given variables, a combination of SMU metrics and digital inequity factors, were looked at instead. While there is no causation or correlation between arts vibrancy and digital equity, there were some relationships worth mentioning.
Government support was an area of interest because its relation to digital inequity factors could signify local governments’ priorities and levels of progress toward digital equity. Figure 6 illustrates the relationship between MSAs’ Government Support Rankings and the percentage of the population without access to broadband of any type. In both graphs, size of the dots is based on the percentage displayed on the x-axis, with a larger size indicating a higher percentage.
Aside from a few outliers, there is a cluster of smaller-sized data points around the origin. This indicates that some cities with strong public arts support have the ability to secure broadband access for close to all residents. However, access does not automatically grant equity. Figure 7 shows the relationship between Government Support rankings to the percentage of people not using the internet at broadband speed. In this graph, more medium and larger-sized dots appear clustered in the middle of the x-axis. A comparison of the two graphs hints toward the idea that while access to broadband may be provided, adequate broadband speed is not.
A comparison of cities based on size showed that medium MSAs in SMU’s list were the most digitally equitable overall while small MSAs were the least equitable. On average, small cities ranked higher than medium or large cities on each digital inequity factor. Medium cities were most equitable in the percentage of high schools offering foundational computer science courses, households without a desktop or laptop, percentage without an internet subscription to broadband, and percentage of broadband subscriptions in households with an annual income of under $20,000. There were no significant trends when analyzed by region. However, cities in the western region were more likely to be less equitable in the percentage of high schools offering foundational computer science courses, percentage without an internet subscription to broadband, and percentage of broadband subscriptions in households with an annual income of under $20,000.
After data analysis, it was concluded that any single MSA’s level of digital equity on any factor studied in this research is dependent on a multitude of other factors unrelated to the arts. Each of the 40 cities on SMU’s list has its own unique history, government, structure, culture, population, and resources. As the next section will show, a complex array of independent factors spanning back several years, perhaps longer, make up the current arts and digital landscapes.
individual Case studies
Jackson, wy
Arts Providers: 4th
Arts Dollars: 7th
Government Support: 5th
Among the small MSAs in SMU’s list, Jackson, WY was found to be one of the most digitally equitable, having some of the lowest rates across categories. It is located in Teton county in western Wyoming, just south of Yellowstone National Park. Although a reported 87.5% of high schools in the county lack a foundational computer science course, only 6.75% of residents lack access to broadband internet. Additionally, 12.7% of its residents don’t have a desktop or laptop at home and 11.25% don’t have an internet subscription to broadband of any type. This level of digital equity is commensurate with SMU’s analysis of its level of arts vibrancy. Their report states that Jackson was found “to have scores within the top 1% on all measures of arts vibrancy, and on all sub-measures related to overall Arts Providers.”
In this rural area, it is almost surprising to see such relatively high levels of digital equity. The same, however, cannot be said about neighboring Fremont county. Fremont is located just east of Teton and is home to the Wind River Reservation. The land is occupied by the Eastern Shoshone and Northern Arapaho tribes. Although arts vibrancy data between the two counties could not be compared, Fremont was found to have much more mixed levels of digital equity than Teton county. In comparing the census data of these two counties, there are a number of notable differences. Fremont county’s population is 22% American Indian and Alaska Native, while Teton county has a population that is about 95% White. The 2017-2021 median value of owner-occupied housing units in Teton county was $945,300 and $207,600 in Fremont county. The poverty level in Teton county is 5.9%. In Fremont county, it is more than double that rate at 14.8%.
Figure 8 shows a general overview of the levels of digital inequity in Teton and Fremont counties. The blue area surrounding Jackson shows Teton county while the mixed orange and blue areas surrounding Riverton show Fremont county.
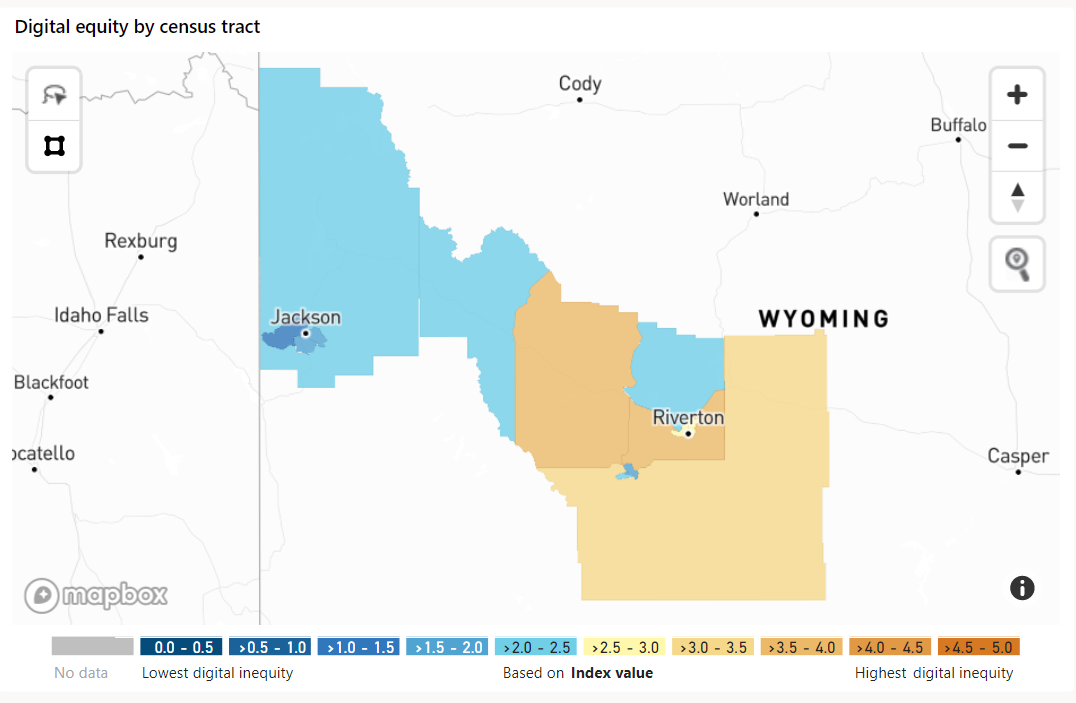
Fig. 8. Source: Microsoft Airband Digital Equity Dashboard
Comparing the percentages of digital inequity factors analyzed in this research revealed some staggering differences. The percentage of households without a desktop or laptop is 12.7% in Teton county, and 26% in Fremont county. The percentage of people not using the internet at broadband speed in Teton county is 44.35% and 62.7% in Fremont county. And in Teton county, 17.7% of households with an annual income under $20,000 don’t have a broadband subscription. In Fremont county, that same statistic is nearly 50%. The differences in these figures point to other underlying systemic issues far past inequities in arts participation. While this is just one example, it points to a longstanding trend of inequity in the United States. An American Indian Policy Institute analysis of FCC data found that only 67% of tribal lands in the continental U.S. have access to broadband internet, with the majority only having access to broadband speeds considered by the FCC to be less than ‘minimally acceptable’. Smaller rural communities already face difficulty obtaining the same resources as larger cities. This barrier is even greater for communities that are less economically secure, which tend to be communities of color, particularly for Native American communities.

New Orleans-Metairie, LA
Arts Providers: 43th
Arts Dollars: 13th
Government Support: 24th
New Orleans-Metairie was the only MSA whose z-scores were relatively high on all digital equity factors, ranging from 0.39 to 2.30. New Orleans and Metairie are located in Orleans and Jefferson parish, respectively. Where the MSA is most inequitable is in its percentage of households without a desktop or laptop at 31%, and its percentage of households without a broadband subscription of any type at 24.2%. Regarding arts vibrancy, SMU found that New Orleans-Metairie’s scores fell “within the top 2% on Arts Dollars overall, including sub-measures around program and contributed revenue, and expenses.”
In recent decades, the opioid crisis, Hurricane Katrina, and increased poverty have devastated the New Orleans area. And because racial inequality has plagued the area for decades, economic and social hardships disproportionately impact communities of color. Nevertheless, the city’s residents and government have not stopped fighting to make New Orleans an “equitable city”. A WK Kellogg Foundation report defined an equitable city as one where “all residents – regardless of their race/ethnicity, nativity, income, neighborhood of residence, or other characteristics – are fully able to participate in the city’s economic vitality, contribute to the city’s readiness for the future, and connect to the city’s assets and resources.” The arts have the opportunity to play a role in this transformation, and some local entities have recognized this.
I Deserve It! is an initiative launched by the Ashé Cultural Arts Center that seeks to bridge the 25-year life expectancy gap that disproportionately impacts Black residents. Artists and culture makers serve as community health ambassadors “in exchange for insurance and a full-time salary.” The group of Community Health Workers, Influencers, Artists, and Nurse Navigators works to bridge to healthcare gap and provide fair wages and benefits to artists. I Deserve It! embraces the idea that the arts are intertwined in the social and public spheres of the community and have the ability to catalyze change, even helping community members meet their basic needs. More simply, artists are an invaluable part of any community. While nothing was found on cross-initiatives between the arts and digital equity, it isn’t out of the question for New Orleans. The Office of Cultural Economy’s mission is to “leverage the innovative and entrepreneurial nature of cultural economic development to achieve deeper outcomes across City projects and priorities.” As the city looks for projects to increase digital connectivity, cross-sector partnerships could be utilized in future endeavors.

Philadelphia, PA
Arts Providers: 66th
Arts Dollars: 6th
Government Support: 23th
Philadelphia provides an example of a complete disconnect between arts vibrancy and digital equity, or other economic measures for that matter. SMU found that its scores fall “within the top 1% on Arts Dollars overall, with strengths in total expenses and compensation paid to those working in arts and culture.” However, in this context, its digital inequities overshadow its strong position in financially supporting its arts and culture workers. Compared to other large MSAs in the top 40 list, Philadelphia ranks higher than average in five out of the six factors analyzed. While broadband access is widely available, almost 41% of people are not using broadband at an adequate speed. Additionally, 30.4% of households don’t have a desktop or laptop and 52.2% of the county’s high schools don’t offer a foundational computer science course. Philadelphia county also has one of the highest rates of households with incomes under $20,000 lacking a broadband subscription, currently sitting at 44.2%.
Along with ranking relatively higher than average in multiple digital inequity factors, Philadelphia has the highest poverty level in the top 40 list, sitting at 22.3% as of 2021. This overlays the issue of income inequality on top of its digital equity challenge. The city released a comprehensive Digital Equity Plan in January 2022 which listed affordability as a top challenge/barrier. The plan states that 42% of residents say that “affordability of internet service or cost of the device was the most important reason they don’t have internet access” and “75% of low-income residents said over $20/month for internet access would be too high.” Other challenges listed include speed, limited internet options, housing vulnerability, intersecting barriers or needs, and limited human touchpoints. In this plan, the arts do not fall in any of its strategies or initiatives for combatting these issues. The plan is focused more on tech-based solutions to improve digital equity. Previous efforts have relied on public-private partnerships to combine resources and knowledge, provide grants to digital equity efforts and schools, and increase digital skills training across the city in multiple languages for increased accessibility.
While the arts and culture sector is currently removed by the local government from any digital equity initiatives, some organizations are creating programming to increase arts access. The city’s Office of Arts, Culture and the Creative Economy launched Arts Access TV to provide both access to city residents and exposure for artists and arts organizations. But a lack of connectedness across sectors may hinder the pace of progress.
conclusion
While this is the first portion of research and is not comprehensive, it serves as an intriguing starting point for the next phases. Findings in the few case studies support the assumption that systemic inequities in the U.S. have contributed to digital inequity and have in time accelerated a process known as “digital redlining.” Analysis solely based on arts vibrancy and participation is not adequate to determine a level of digital equity in any one area. Digital inequity is in and of itself complex because it is multi-faceted, as is arts vibrancy. By including a number of other factors such as demographics, historical data, and analysis of local government efforts and priorities each of the 40 arts-vibrant cities could be its own case study.
The next phase of this research will likely attempt to answer the next two research questions:
In cities where new media and digital arts are prevalent, where does their level of digital equity fall in relation to engagement in this art medium?
How does digital inequity correlate with arts participation?
While this iteration focused on descriptive statistics and analytics with some case study material, the hope for future research is to feature more qualitative data and stories that highlight successes at the intersection of the arts and digital equity.
-
“A Digital Equity Plan For the City of Philadelphia.” Office of Innovation & Technology. January 2022. Accessed March 25, 2023. https://www.phila.gov/media/20220215130307/Digital-Equity-Plan.pdf.
“About our program.” I Deserve It! Accessed March 23, 2023. https://www.ideserveitnola.org/about.
Aisyah, Kirana. “Philadelphia, U.S. Launches Digital Equity Plan.” OpenGov Asia. February 21, 2022. https://opengovasia.com/philadelphia-u-s-launches-digital-equity-plan/.
“An Equity Profile of New Orleans.” PolicyLink. 2017. Accessed March 20, 2023. https://nationalequityatlas.org/sites/default/files/EP-New-Orleans-june21017-updated.pdf.
“Arts Access TV.” The Office of Arts, Culture and the Creative Economy. Accessed March 25, 2023. https://www.creativephl.org/programs/arts-access-tv/.
Chavez, Agnes. “How Artists Can Bridge the Digital Divide and Reimagine Humanity.” June 2021. Accessed November 18, 2022. National Endowment for the Arts. https://www.arts.gov/impact/media-arts/arts-technology-scan/essays/how-artists-can-bridge-digital-divide-and-reimagine-humanity.
“Digital Equity: Explore.” Microsoft. Accessed February 12, 2023. https://app.powerbi.com/view?r=eyJrIjoiM2JmM2QxZjEtYWEzZi00MDI5LThlZDMtODMzMjhkZTY2Y2Q2IiwidCI6ImMxMzZlZWMwLWZlOTItNDVlMC1iZWFlLTQ2OTg0OTczZTIzMiIsImMiOjF9.
Federal Communications Commission. “Fourteenth Broadband Deployment Report.” FCC. January 19, 2021. https://www.fcc.gov/reports-research/reports/broadband-progress-reports/fourteenth-broadband-deployment-report.
“I Deserve It!” Ashé Cultural Arts Center. Accessed March 19, 2023. https://www.ashenola.org/ideserveit.
“Mayor's Office of Cultural Economy.” The City of New Orleans. Accessed March 23, 2023. https://nola.gov/cultural-economy/.
“State Digital Equity Scorecard.” National Digital Inclusion Alliance. July 22, 2021. Accessed February 13, 2023. https://digital-skills-map.digitalinclusion.org/.
“New Orleans Creatives Get to the Heart of the Matter.” Mellon Foundation. November 10, 2022. https://mellon.org/shared-experiences-blog/new-orleans-creatives-get-heart-matter/.
Oliver, Lauren. “Levels of Measurement: Nominal, Ordinal, Interval and Ratio.” Indeed. Updated December 15, 2022. Accessed March 19, 2023. https://www.indeed.com/career-advice/career-development/levels-of-measurement.
“Our Methodology.” SMU DataArts. Accessed February 12, 2023. https://culturaldata.org/arts-vibrancy-2022/methodology/.
“QuickFacts - Fremont County, Wyoming; Teton County, Wyoming.” United States Census Bureau. Accessed March 26, 2023. https://www.census.gov/quickfacts/fact/table/fremontcountywyoming,tetoncountywyoming/RHI325221#RHI325221.
“QuickFacts - Philadelphia County, Pennsylvania; Pennsylvania.” United States Census Bureau. Accessed March 26, 2023. https://www.census.gov/quickfacts/fact/table/philadelphiacountypennsylvania,PA/PST045221.
“SMU DataArts Releases List of 40 Most Arts-Vibrant Cities in the U.S.” SMU DataArts. December 15, 2022. https://culturaldata.org/about/press-releases/smu-dataarts-arts-vibrancy-index-report-vii/.
Spiegel, Jennifer. “Bridging the Digital Divide in Native American Communities.” New Jersey State Policy Lab. Accessed March 30, 2023. https://policylab.rutgers.edu/bridging-the-digital-divide-in-native-american-communities/#:~:text=According%20to%20an%20American%20Indian,be%20less%20than%20'minimally%20acceptable.
“Tech as Art: Supporting Artists Who Use Technology as a Creative Medium.” National Endowment for the Arts. June 2021. Accessed November 18, 2022. https://www.arts.gov/impact/research/publications/tech-art-supporting-artists-who-use-technology-creative-medium.
“The Top 40 Arts-Vibrant Communities of 2022.” SMU DataArts. Accessed February 12, 2023. https://culturaldata.org/arts-vibrancy-2022/the-top-40-list/.
Valero de Urquía, Beatriz. “Powering Digital Equity in Philadelphia.” Tech for Good. December 9, 2022. https://www.techforgood.net/casestudies/powering-digital-equity-in-philadelphia/.
“Wind River Indian Reservation.” Wyoming’s Wind River Country. Accessed March 27, 2023. https://windriver.org/destinations/wind-river-indian-reservation/.
Yvette Scorse, “What Is Digital Inequity?” National Digital Inclusion Alliance. October 6, 2021. https://www.digitalinclusion.org/blog/2021/10/06/what-is-digital-inequity/.