

USER RETENTION
As discussed in a previous article, UX design in museums is as crucial as it's ever been. In a society that is moving out of the pandemic and back into the public sphere, it is imperative for museums to get creative with solutions for new, “innovative,” and exciting UX designs to drive attendance back to in-person visits. However, this may be easier said than done.
As different types of museums (art, natural history, botanical, etc.) are problem-solving and experimenting with different UX designs to solve this issue, how is technology playing a role? It is first important to understand the psychology behind the user flow to create a design that is captivating and engaging to the viewer. A dissertation written by Zainab Al-Hajji entitled Applying User Experience (UX) Design in Interior Space for Art, Science Museums, and Learning Environments describes not only the history of museum displays, but also analyzes the modes of learning and transferring of information associated with uniquely individual UX flows. (Al-Hajji, 2017) The complexity of learning identities is a concept that has been studied and laid out in multiple ways. For the purpose of analyzing UX design, the creation of the Learning Pyramid is a visual that helps explain the most effective ways to convey information about retaining information. (Lalley & Miller, 2007)
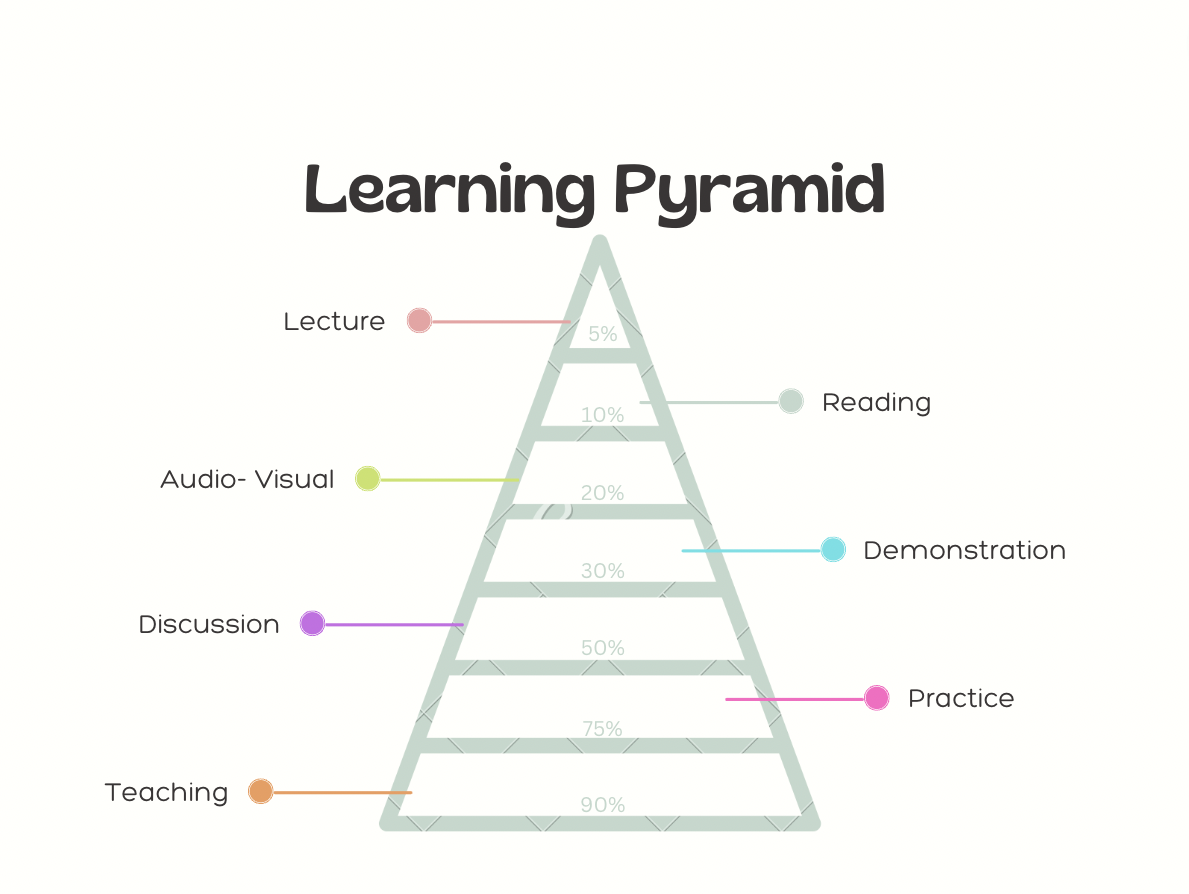
Chart made by author, adapted from Education Corner’s graphic.
USER FLOW
The model shows that the most effective mode of learning is through teaching, followed closely by practice-by-doing, and preceded by discussion, demonstration, audio-visual, reading, and then lecture. For the sake of museum learning, most of these methods can be applied. For example, many exhibits contain large descriptions that require reading and a maintained focus, but given that this learning method only contributes to 10% of effective learning retention, it is likely that a small number of viewers would engage in an exhibit that requires a lot of reading to comprehend the material. Museums are incorporating technology to be able to portray the demonstration and practice-by-doing models to the viewers to maximize the sample user flow to the best it can be.
The layout and floor plan of a museum impacts how a user interacts with the exhibits. A user journey is a personal path that a viewer takes to interact with and view the exhibit that they are presented with. As discussed by Al-Hajji, users are presented with an internal decision making process while interacting with an exhibit. As seen in the figure below, the user may make the decision to stop and engage with the exhibit, and then proceed to read, look, take photos, discuss, or try. (Rosenzweig, 2015) On the other hand, the user may make the decision to scan the exhibit and then walk away, completely unengaged.
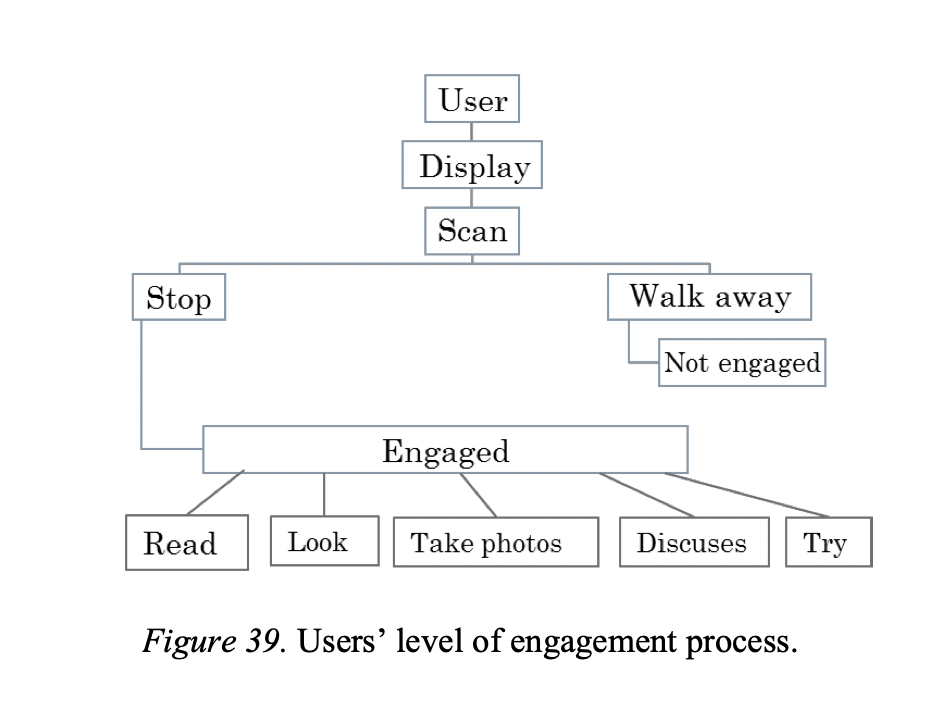
Chart from dissertation written by Zainab Al-Hajji.
Users can view an exhibit in more ways than one may think. As seen in the figure below, the way that a user views an exhibit is dependent on the manner in which an exhibit is laid out. Exhibits that are created in a linear fashion are easily viewed in a fan pattern, while a “star” exhibit may cause the viewer to weave through the exhibit in a more immersive manner. Although no display is necessarily considered the “right” one, it is important for museums to consider how they want their users to perceive the exhibit, and then make strategic decisions about the layout to optimize user interaction, flow, and experience design.
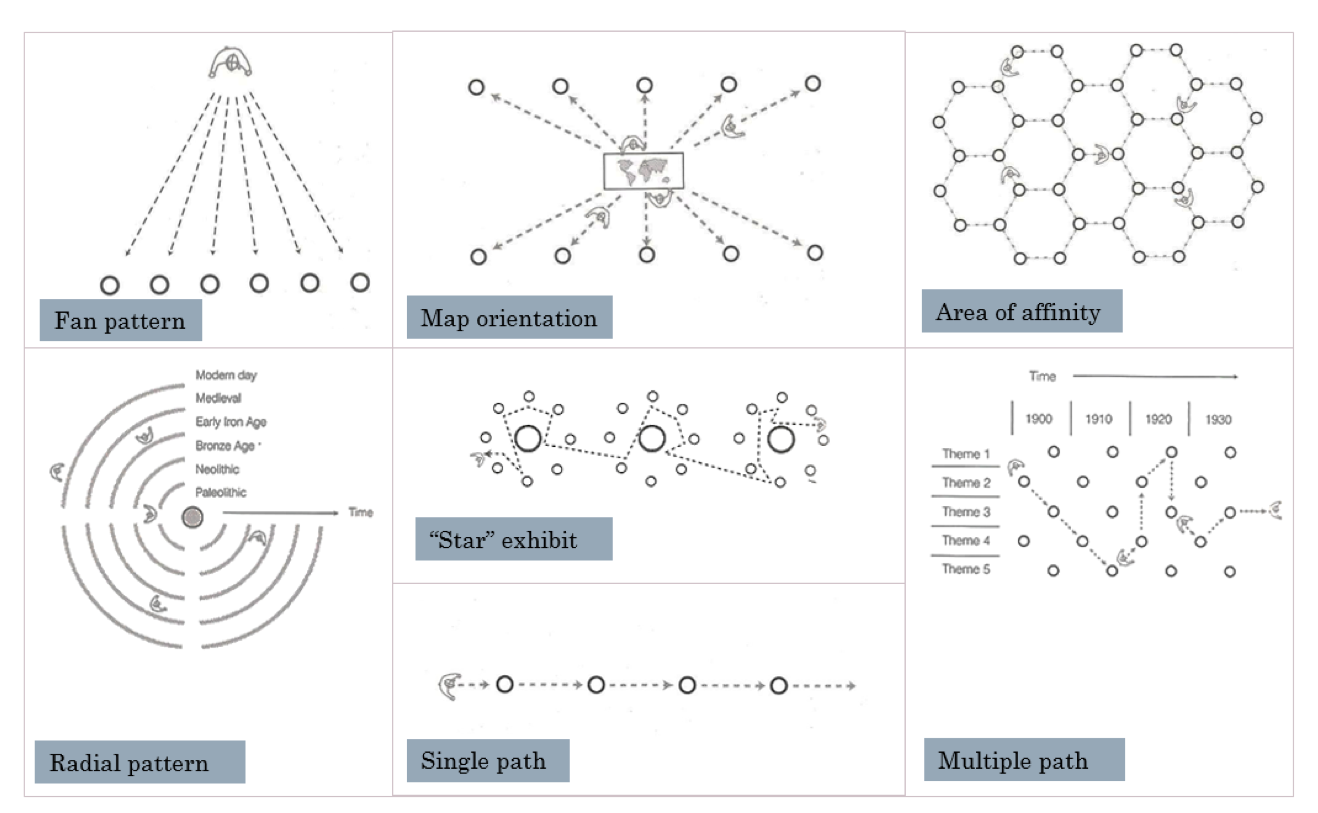
Chart from dissertation written by Zainab Al-Hajji.
A user’s path is also imperative to the successful interaction with an exhibit. As seen in the figure below, the path of an engaged user is quite different from the path of an unengaged user. Depending on the layout of the exhibit, a user may have to walk around barriers within the exhibit that are impossible to avoid, which is likely an attempt made by the exhibit designer to force the user to interact with the exhibit. Or, an exhibit designer may take the approach of displaying the entirety of the exhibit on the bordering walls. Again, neither choice is necessarily the “right” one, and the decision would ultimately depend on the theme of the installation.
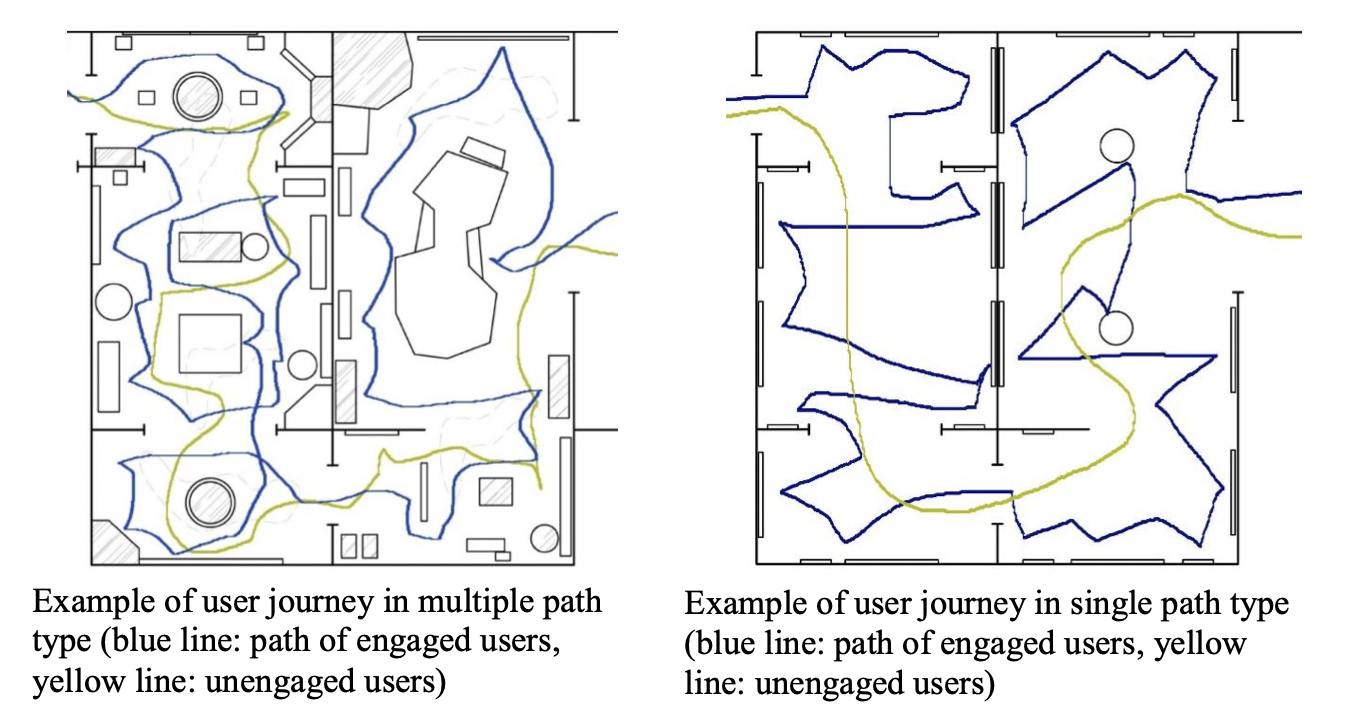
Chart from dissertation written by Zainab Al-Hajji.
BEST EXPERIENCE DESIGN OF 2022
Many museums across the United States are implementing “innovative” UX designs and have even won awards for their efforts. An award for the Best Experience Design of 2022 was given to multiple honorees by Fast Company in September. Coming in at number one in the rankings, and the winner of the award, was the Life and Work of Frida Kahlo immersive exhibit. The exhibit was described as, “An immersive exhibit that uses creative storytelling to reimagine the museum experience and increase accessibility to art.” With more than 80,000 visitors since its opening in Madrid, the exhibit is in the process of traveling across the world reaching Puerto Rico and moving eventually to Mexico, Singapore, Japan, Australia, and New Zealand.
The exhibit is described by the designer and promoter, ACCIONA, as one that, “offers visitors an innovative experience halfway between cinema, large-scale audiovisual shows, and traditional museums.” In the exhibition space, the room is equipped with 1,129m2 of HD projection surfaces, 38 high-end projectors, and over 100 projections of Frida’s “pictorial, literary and photographic works.” It is widely known that immersive exhibitions, specifically in the United States, have oftentimes seen success due to their picturesque offering and individuality from the typical static museum exhibit. By complementing the work of Frida Kahlo with high-quality projection and technology, ACCIONA was able to create an innovative experience that is now a worldwide sensation.
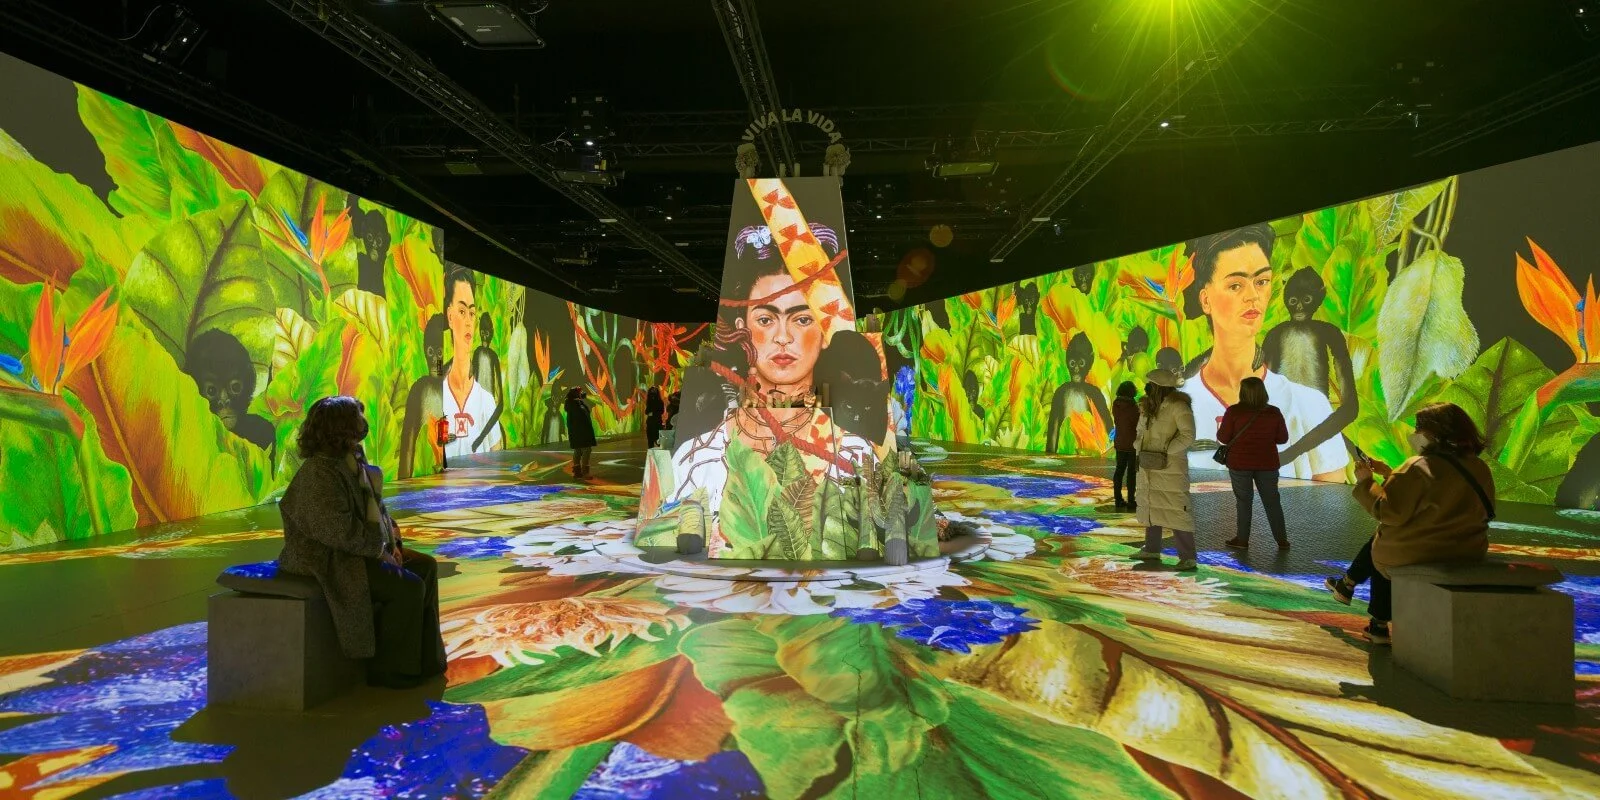
Life and Work of Frida Kahlo presented by ACCIONA.
Listed as an honorable mention on the awards list is The Cleveland Museum of Art’s exhibit titled Revealing Krishna: Journey to Cambodia’s Sacred Mountain. The exhibit is described on the museum’s informational page as a:
“Digital rendering of 'The Story of the Cleveland Krishna.' The mixed-reality tour culminates with a life-size holographic representation of the original cave temple on Phnom Da, where visitors are invited to walk around an artist’s re-creation of the sculpture as it might have stood.”
The Cleveland Museum of Art was able to partner with a mixed-reality development team at The Interactive Commons at Case Western Reserve University to create an exhibit that is fueled by technological innovation. By contrasting the art created nearly 1,500 years ago with the technology available in the year 2022, an interesting user experience is created through an immersive, mixed-reality “HoloLens tour.” The tour is conducted by:
“Visitors wearing HoloLens 2 headsets see high-resolution 3-D holographic projections of sculptural pieces accompanied by spatial audio and narration as they experience the myth of Krishna lifting Mount Govardhan and come to understand the sculpture’s history. The tour culminates in a life-size holographic projection of the cave temple on Phnom Da where the Cleveland Krishna appears to have stood. Visitors enter the sanctuary to find an artist’s re-creation of the sculpture showing Krishna supporting the mountain in which he stands.”
The implementation of technology makes it stand out from the rest. Not only is cultural heritage restored, but it is also shared in a way that would not typically be possible through a simple photograph.
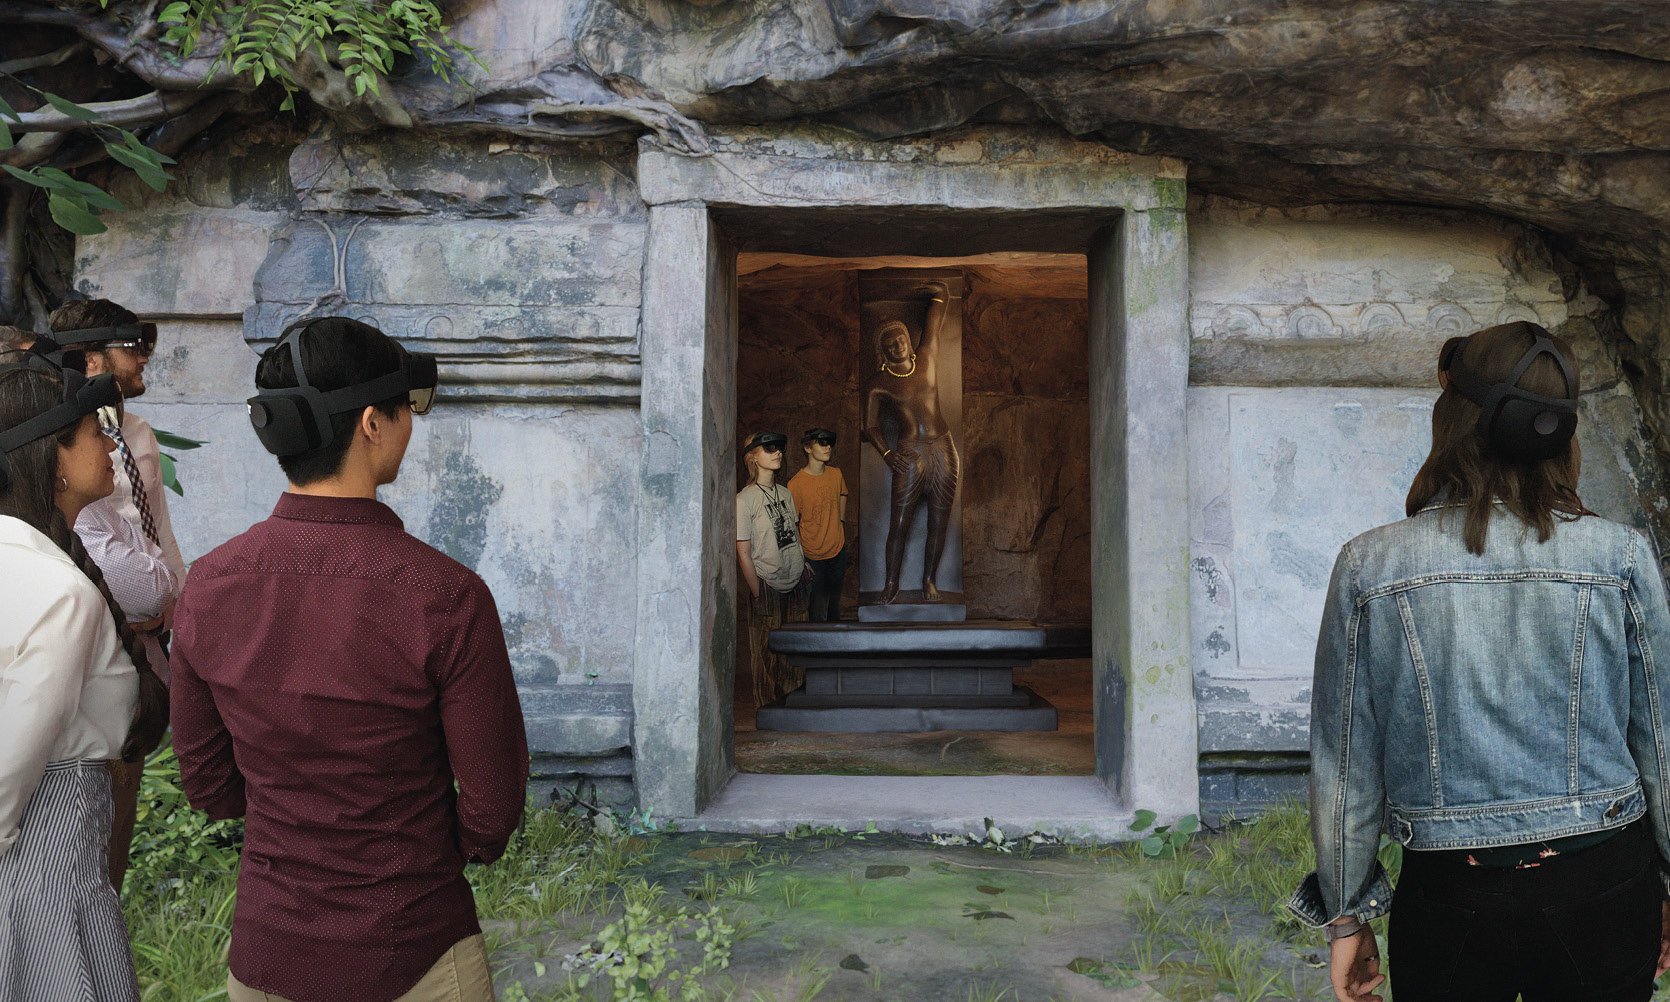
Revealing Krisha: Journey to Cambodia’s Sacred Mountain exhibit at The Cleveland Museum of Art.
ORGANIZATIONS RESPOND TO UX DESIGN SURVEY
Japanese American Museum of San Jose
Other museums across the country are also desiring to improve and update their exhibits to include exciting UX designs, but simply do not have the team or the funds to be able to do so. To recall, as discussed in Part 1 of this research, The Japanese American Museum of San Jose had been recognized by the Knight Foundation through a $100,000 grant:
“To leverage augmented reality and art, enhancing the museum’s connections with the surrounding community: The museum will do outreach and conduct workshops with local community members, incorporating their ideas and aspirations into an augmented reality experience that reveals the multi-ethnic history and culture of San Jose’s Japantown district.”
A survey was sent to a member of the museum’s staff, Vanessa Hatakeyama, who is also the Japantown Community Congress of San Jose Treasurer. After the 14 months that Hatakeyama has been working at the museum, she admits that the exhibits are a tad bit outdated, and explained that the museum was primarily run by volunteers for 35 years including the building interior and exhibit displays. Unsurprisingly, the museum was awarded this grant money prior to the pandemic, and it is quite possible that the funds allocated for the AR experience development went elsewhere to simply keep the museum alive. When asked about what technology the organization is using to improve UX design in the exhibits, Hatakeyama responded:
“We are very behind on this, but recently added QR codes to a portion of our gallery that translates the text of the exhibit into several languages. But we do need a lot of work in this area in general. For the most part, our gallery has not received many updates for the past 10 years. We also have 4 displays that show videos and documentaries that highlight some of the oral histories and achievements of Japanese Americans and share the story of the WWII incarceration.”
Ultimately, it does not appear that the organization was able to allocate these funds into creating any other augmented reality experiences other than their Hidden Histories AR exhibit as previously mentioned. The survey also asked about what the organization does not have in the exhibits that museum staff believes would be beneficial for attendance, to which Vanessa responded:
““A curator who can professionally manage the exhibit space is probably what we’re missing. I always think the human element is so important, so having a full staff of well-trained docents and more human interaction elements is something I think we’re missing. Being mostly volunteer operated, we don’t always have docents on site for guests.””
Hatakeyama recognizes the importance of technological implementation in the UX design process. However, in uncertain times it can be difficult to ensure that a particular vision is met and properly executed. Although the museum is lacking from a technological perspective, there are two exhibits that drive attendance during the months that they are on display. As described by Hatakeyama, the rotating gallery exhibit known as Creatives of Japantown features local artists in the area and helps enhance the overall experience and culture of Japantown San Jose. Works within the exhibit include those by Juan Carlos Araujo of Empire 7 Studios, Taki Kitamura of State of Grace Tattoos, and Momo Cha, who creates local chalk sidewalk murals. The inclusion of this exhibit is especially important to the museum’s attendance due to the fact that the exhibit features local artists and the culture of the town. The simplistic, linear exhibit design focuses solely on the work presented by the artists to create no distraction other than the art in the room.

Creatives of Japantown exhibit at the Japanese American Museum of San Jose.
In addition to this, the Japanese Girl's Day (Hinamatsuri) doll exhibit is a crowd favorite that focuses both on Japanese culture as well as art and history. The main feature is that the dolls are all handmade and some were created by families who were incarcerated in internment camps during WWII, making the exhibit especially important to the history of the town and the culture. The display created for the exhibit is intentional and strategic to ensure an accurate representation of a traditional Hinamatsuri doll exhibit. The use of intense color, decor, and light are strategic in the way that they suggest importance and sacred emotion in the exhibit.

Hinamatsuri doll exhibit at the Japanese American Museum of San Jose.
According to the museum’s records via Hatakeyama, there is a 15-20% spike in attendance during the months when each of these exhibits are displayed. Although the museum has clearly implemented the use of AR in one of their exhibits and utilizes QR codes to improve accessibility and user experience, it is important to recognize that the imagined potential for the use of new digital technology during, and after, the pandemic has seemed to have stalled.
Phipps Conservatory and Botanical Gardens
Another organization that responded to the survey was Phipps Conservatory and Botanical Gardens in Pittsburgh, Pennsylvania.
The respondent to the survey, Joe Reed, serves as the Director of Communications at Phipps. Phipps has a new flower show for every season and is currently featuring a Winter Flower Show and Light Garden, an exhibition that they have every winter that is the biggest exhibit as it expands to cover both indoor and outdoor spaces. There is also a Tropical Forest Hawai’i exhibit ongoing through 2025. When asked about how the UX design of the building’s architecture affects the exhibits and audience experience, Reed responded:
““Being a 130-year-old facility, we skew toward analog UX to minimally disrupt the historical continuity of the experience but also try to reduce our dependence on disposable materials. For example, we’ve recently shifted our wayfinding materials from a printed brochure to persistent YOU-ARE-HERE signage and a QR code affording a digital version of the map to load on users’ smartphones.” ”
Phipps has also taken steps to use monitors with closed-captioned video loops to explain complex concepts, particularly in the Tropical Forest exhibit. A main question was concerning if the organization housed any touch screens or app technology built into any exhibits, to which Reed responded:
“Not at this time, though we have in the past (and hope to again) have an interactive dashboard installed in our Center for Sustainable Landscapes to show real-time building performance data and explain the inner workings of the building. (The old interface failed and needs replacing.)”
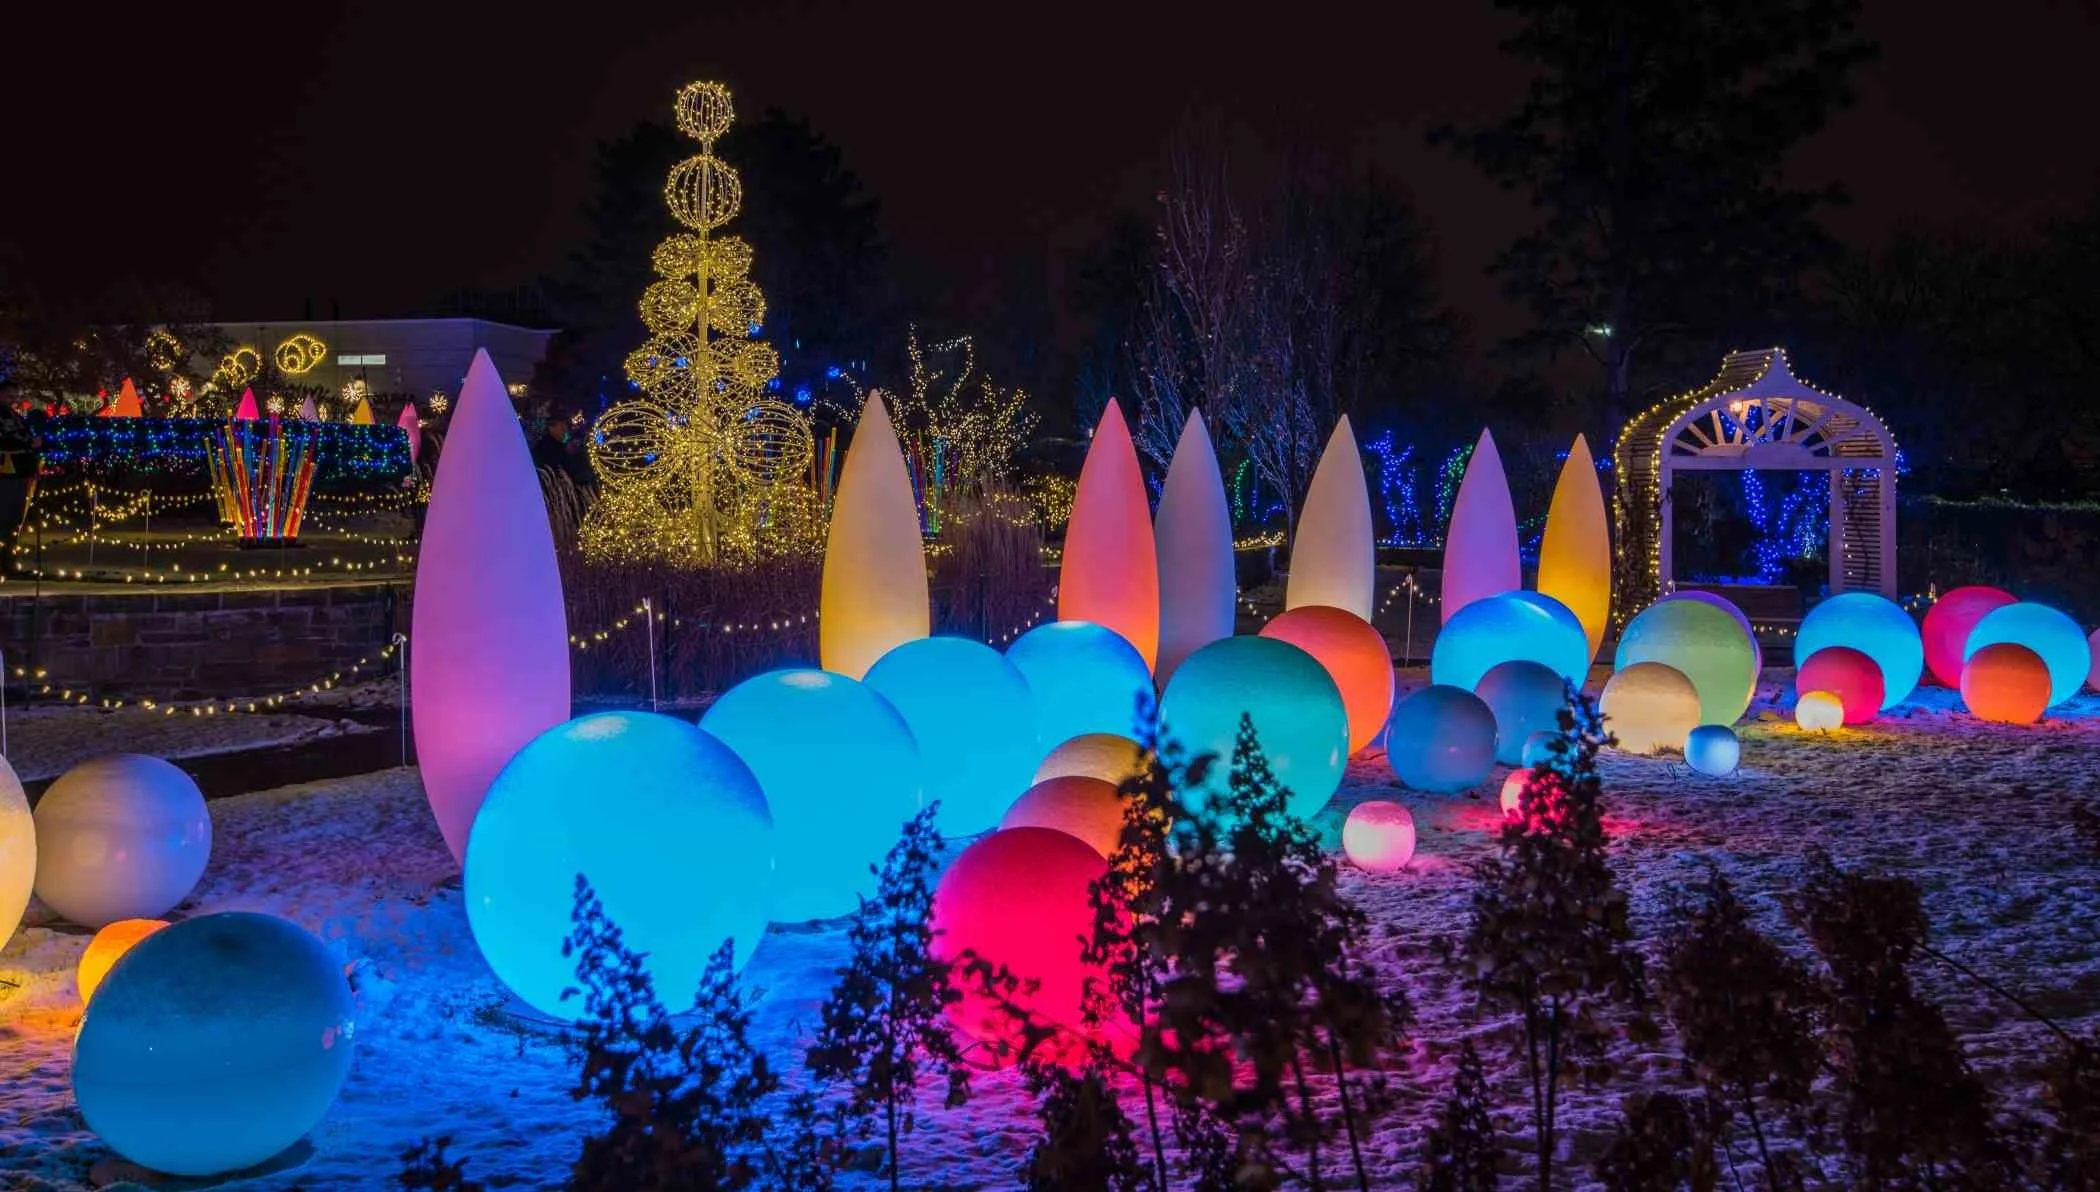
Winter Flower Show and Light Garden outdoor exhibit at Phipps Conservatory and Botanical Gardens.
Reed also feels that the creation of an app with an interactive map that tracks location via GPS and allows for dynamic seasonal updates, notices of temporary closures, and push notifications of new shows and experiences would be beneficial to improve the technology offerings of the museum. It is also important to recognize how the museum utilizes the installation of string lights to create a natural UX flow within their exhibits to guide their audience.
By using interesting visuals to guide the path of the user, the museum successfully creates an immersive environment where the users are quite literally encompassed by the exhibit at all times. In addition to this, given the fact that the exhibit exists both indoors and outdoors, the continuation of the UX design creates a flow that is easily understood and intriguing to make the user want to experience more.
Because of the uniqueness of the UX design and attention to detail, Phipps sees close to 500,000 annual visitors, mostly exhibit driven. Comparing the attendance rate of 2020, which plummeted by more than 300,000, Phipps Conservatory was able to regain about 165,000 attendees lost in the fiscal year 2021, jumping 66% from 2020 to 2021. (Pittsburgh Business Times, 2022) Ultimately, Phipps was able to recover their original annual visitors of 500,000 in 2022. It can be argued that this recovery is largely attributed to the innovative offerings that Phipps provides to the community.
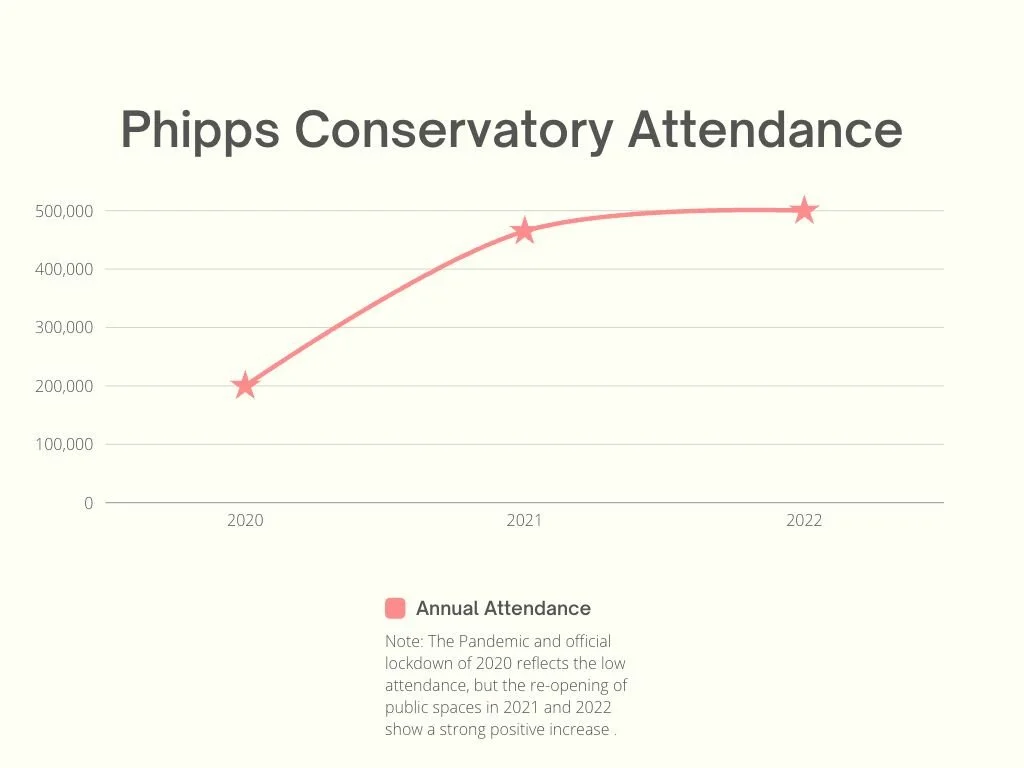
Chart made by author.
Conclusion
While multiple museums were sent the survey to acknowledge their achievements in “innovative” UX design, the responses of some are still awaited. As museums continue to recover both financially and socially from the pandemic, it is anticipated that interesting UX design will continue to develop with the help of technology and those who are dedicated to creating an exciting user experience for the audience who keeps their museum alive.
-
Sonnet, Samantha. “2022 UX Designs in Museums: How Are ‘Innovative’ Exhibits Driving Attendance?” Arts Management and Technology Laboratory. November 16, 2022, https://amt-lab.org/blog/2022/10/2022-ux-designs-in-museums-how-are-innovative-exhibits-driving-attendance.
Al-Hajji, Zainab. “Applying user experience (UX) design in interior space for art, science museums, and learning environments.” Eastern Michigan University Master's Theses and Doctoral Dissertations. 2017, https://commons.emich.edu/cgi/viewcontent.cgi?article=2167&context=theses.
Education Corner. “The Learning Pyramid.” Accessed February 9, 2023. https://www.educationcorner.com/the-learning-pyramid.html.
Lalley, James P.; Miller, Robert H. “The Learning Pyramid: Does It Point Teachers in the Right Direction?” Institute of Education Sciences. Accessed December 8, 2022, https://eric.ed.gov/?id=EJ790160.
Rosenzweig, Elizabeth. Successful User Experience: Strategies and Roadmaps. Amsterdam, Netherlands: Morgan Kaufmann, 2015.
“The Best Experience Design of 2022.” Fast Company. September 15, 2022, https://www.fastcompany.com/90771039/experience-design-innovation-by-design-2022.
“Fast Company | Business News, Innovation, Technology, Work Life and Design.” Accessed December 13, 2022. https://www.fastcompany.com/.
“Immersive exhibition on Life and Work of Frida Kahlo is extended until May 31st.” ACCIONA. April 26, 2022, https://www.acciona.com/updates/news/immersive-exhibition-life-work-frida-kahlo-extended-until-may-31st/?_adin=02021864894.
“Exhibition Life and Work of Frida Kahlo: Acciona. Madrid.” Acciona. Accessed December 13, 2022. https://www.accionaexhibitions.com/en/.
Cleveland Museum of Art. Accessed December 13, 2022. https://www.clevelandart.org/.
“Revealing Krishna: Journey to Cambodia’s Sacred Mountain.” The Cleveland Museum of Art. Accessed December 8, 2022, https://www.clevelandart.org/exhibitions/revealing-krishna-journey-cambodias-sacred-mountain.
“Connecting People through Images to Drive Research and Learning Innovations.” Interactive Commons at CWRU. Accessed December 13, 2022. https://interactivecommons.org/.
“Japanese American Museum of San Jose: Home.” JAMsj. Accessed December 8, 2022, https://www.jamsj.org.
“Knight Foundation: Home.” Knight Foundation. Accessed December 8, 2022, https://knightfoundation.org.
“Hidden Histories of San Jose Japantown: Liberation Technology, Art, and Community Building in Action.” JAMsj. Accessed December 8, 2022, https://www.jamsj.org/hidden-histories.
“Creatives of Japantown.” JAMsj. Accessed December 8, 2022, https://www.jamsj.org/upcoming-events/2022/9/10/creatives-of-japantown.
“Hinamatsuri Doll Displays.” JAMsj. Accessed December 8, 2022, https://www.jamsj.org/upcoming-events/2022/2/22/hinamatsuri-doll-displays-in-san-jose-japantown-and-jamsj.
“Japantown Community Congress of San Jose: Home.” JCCsj. Accessed December 8, 2022, https://www.jcc-sj.org/about.
“Phipps Conservatory and Botanical Gardens: Home.” Phipps. Accessed December 8, 2022, https://www.phipps.conservatory.org.
Lott, Ethan. “Museums attendance in Pittsburgh region recovered in 2021, two new attractions opened in 2022.” Pittsburgh Business Journal. November 25, 2022, https://www.bizjournals.com/pittsburgh/news/2022/11/25/museums-pittsburgh-attendance-recovered.html.
“Holiday Magic! Winter Flower Show and Light Garden.” Phipps. Accessed December 8, 2022, https://www.phipps.conservatory.org/calendar/detail/holiday-magic?utm_source=google&utm_medium=cpc&gclid=CjwKCAiAs8acBhA1EiwAgRFdw8lc0VntIrjntQ304HO4z9xSkAVMU9wLXWh2xRxL2pZAoPttn3JdqhoCp1IQAvD_BwE.
“Tropical Forest Hawai’i.” Phipps. Accessed December 8, 2022, https://www.phipps.conservatory.org/calendar/detail/tropical-forest-hawaii.