

This is a case study from a 3-part series. Read part 1 on an introduction to web and data scraping. Continue reading here to learn about how these techniques can be used to observe relationships between producers and fans.
How well do you know the history of your industry? Could you list every branch, every individual, that helped to develop your industry into the complex and beautiful thing it is today? If you asked someone who works in the arts to craft such an image or list, they’d probably be able to give you a significant list of names. Yet, the truth is, a single individual’s list can’t provide the entire picture, just their perception of what the tree looks like. This is not to say that such viewpoints aren’t valuable, for they are wonderful snapshots of what information a person has been exposed to throughout their lifetime. Rather, what they show is an opportunity for exploration and learning for an industry and the individuals within it to gain a deeper understanding of how it came to exist in the form it is today.
As an art form traditionally taught through verbal means and physical practice, the dance industry is notorious for being difficult to decipher, as an insider or otherwise. There are a number of key figures who were, and are, instrumental in the development of the many styles found within – ballet, modern, contemporary, tap, etc. – however student knowledge of genre-specific history (and I’d wager even a number of professionals and teachers) is limited to that which they’ve been exposed to throughout their studies. Observationally, this, of course, makes sense: each of us are products of the environments where we spend the greatest amounts of time, which for dance often results in the following of a specific style or teacher(s). Unfortunately, this often leaves many blind to past and existing influences that are instrumental in understanding the historical and artistic development of their artform. So, what would happen if dance historians, educators, and museums were able to visually illustrate the vast and complex network upon which the dance industry stands today for anyone to see?
Enter stage left, the digital humanities. A field that regularly debates what its “true” definition really is, the digital humanities addresses work that is done at the intersection of traditional humanities – fields such as language, literature, geography, art – and digitally-based technologies through collaboration, connection, and interpretation to deepen our understanding in ways that traditional methods don’t allow for. Examples of projects within the field include the recent identification of the anonymous printers of John Milton’s famous 1644 pamphlet “Aeropagitica” and the 2015 digital recreation of Sir Francis Bacon’s social network, The Six Degrees of Sir Francis Bacon, both of which were completed by research teams at Carnegie Mellon University. While these projects were done under the umbrella of an academic institution, the digital humanities (DH) is not limited to a sole existence within that sphere. Encouraging the exploration of learning, of finding new connections that were previously unknown and broadening the realm of possibilities, the DH field has much to offer the arts, particularly when it comes to creating expansive educational visuals for use by teachers and curators, interactive displays, comprehensive informational websites, and more.
Network Mapping
Network mapping, or the illustration of structured data “that facilitate detection of patterns and trends”, helps researchers dig deeper into the information that has been pulled by their crawlers. There are many ways to approach the creation of a network map, but there is one in particular that will assist the dance industry in visualizing its history most effectively: the social network map. In terms of its basic structure, the social network map is no different from any other network map, depicting a set of aggregated data in a dynamic visual based upon the patterns identified and encoded within. When considering and interpreting the data, the difference lies in what, or who, the program is looking at and how the visual is read. “[U]sed to determine and understand the nature of social interactions between individuals as well as groups … [social network mapping] helps in figuring out which individuals hold what level of influence over another individual or group” (ThinkDesign). As previously mentioned, within the dance industry social boundaries and pathways are often determined by the technical style a dancer trains within (e.g. Balanchine, Vaganova, Royal Ballet Academy syllabus, etc.), often synonymously correlated with a particular teacher or school. By mapping out who dancers trained under or worked with using specific social connectors, we can determine the extent and origins of such behaviors. What better way for the dance industry to see where it’s been and where it could be going than by considering how its members are connected?
So, how does a social network map come into being? To begin, data must be sorted to identify the nodes a researcher wishes to use--in this case the individuals or “actors” from the dance industry-- by creating unique IDs through the association of alphabetical or numerical characters. Once the nodes have been pinpointed, the existing “ties”, or social relationships, between each must also be encoded using numerical designations or “weights”-- such as a 0 for no relationship and a 1 for relationship noted-- and a directional status. The latter works to visualize the flow of influence and is often entered in variations of “directional” or “unidirectional”. The following images are examples of structuring data for Gephi using Excel Spreadsheets. To the left are nodes and to the right are edges, using harvested data about prominent modern dance choreographers and their students:
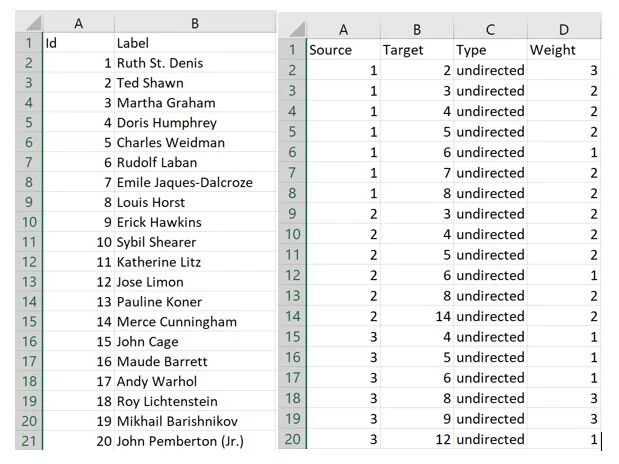
Figure 1: Data structured in Excel spreadsheets representing nodes and edges. Source: Author.
There are many ways to structure desired data, so care should be taken to ensure the program being used can read the internal formatting. These two steps are crucial in bringing the visualization of data to life for deeper consideration. A note: Keeping in mind the inherent delineation within the dance industry, there will be a constant risk of bias when harvesting data. The guiding metrics could easily be skewed unless decisions regarding who is selected as the starting points for a data set are defined on broad terms. It is very easy to stay within familiar realms; however, the desired result of a comprehensive view can only be achieved by reaching past comfort and building a research team that spans multiple genres. In the context of our question, images created from this method of structuring data can be used to reveal where stylistic influence may have originated, determine who had the most influence on who, where groupings of individuals (both known and unknown) reside, and to uncover relationships/influence that may have been previously obscured or unknown. All this can be done by observing the overall shape of the network, how many ties exist, and the size of the nodes if they were weighted. Armed with this knowledge, dance historians and curators of any institution can not only teach students about the layers of complexity within genre-specific groupings but also illuminate connections that exist between styles, perhaps even between dance and other fields.
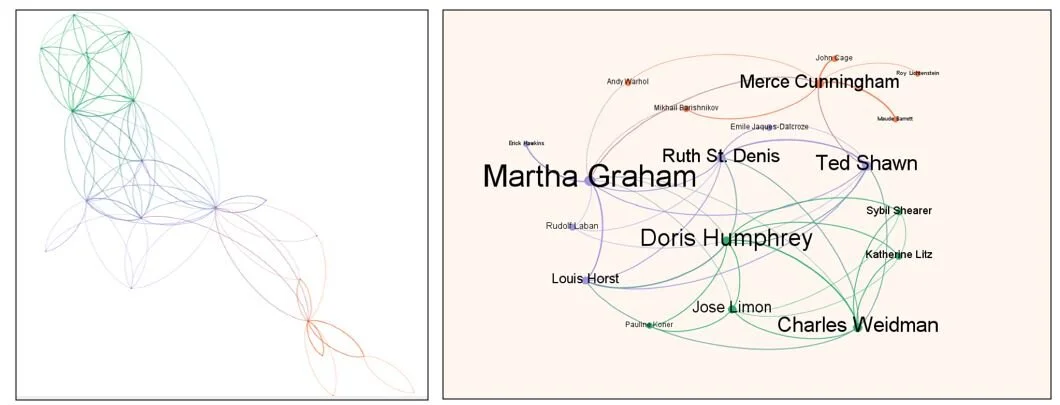
Figure 2: Social network map samples of prominent modern dance choreographers, without labels (left) and with identifiers (right). Source: Author.
Limitations
As with any research approach, it is important to understand the technical limitations of the methods being used: What kind of data does a method handle? How much? In what way does the program read the data? Can my two methods be combined? The article Increasing Data Collection Capabilities discusses the method of data scraping, which uses the processing power of computers to identify and pull together large amounts of information. When comparing data scraping to social network mapping, it becomes clear that there are two key differences between them that could pose complications to someone who may be unfamiliar with either method. Firstly, the type of data each can handle is not the same. As an aggregator of data, data scraping can pull both qualitative and quantitative data into structured tables based on what a researcher wants to pull. Social network mapping, on the other hand, can only handle qualitative data, and as a result, any quantitative data pulled through data harvesting must be modified for compatibility. This is often done by designating specific numerical characters as a key to indicate its origin. Secondly, the amount of data each method can use differs. Looking again to its most basic purpose, data scraping can pull vast amounts of data if it is programmed accordingly. It is limited only by the metrics imposed by the researcher and maximum file sizes. Since social network mapping is based upon real-world networks of social movement and communication, it is limited to the connections that exist between individuals and results in a limited sample size. This is partially due to a theoretical limitation known as “”, or the belief that everyone in the world can be connected through an average of five intermediate connections (themselves comprising the sixth). A bit counterintuitive, this theory relies on the existence of random acquaintances outside of an individual’s social cluster, or the people they interact with on a day-to-day basis, through whom a person may be connected to another social cluster (Science Alert). Should random acquaintances not exist, the number of average intermediate connections between individuals drops, as it is likely that most people within a cluster know each other directly or within at least two connections, thus resulting in a complex but closed network. the six degrees of separation”, or the belief that everyone in the world can be connected through an average of five intermediate connections (themselves comprising the sixth). A bit counterintuitive, this theory relies on the existence of random acquaintances outside of an individual’s social cluster, or the people they interact with on a day-to-day basis, through whom a person may be connected to another social cluster (Science Alert). Should random acquaintances not exist, the number of average intermediate connections between individuals drops, as it is likely that most people within a cluster know each other directly or within at least two connections, thus resulting in a complex but closed network.
Considering the current globally pervasive use of social media platforms, the average number of degrees today is believed to be closer to four, with access to random acquaintances dramatically increased through the multitude of mobile apps we use to communicate with one another. If we reflect upon the nature of the dance industry, it’s not a far stretch to believe that few random acquaintances might exist, at least within certain social clusters based on technical style. Ballet dancers are more likely to know other ballet dancers, tap dancers are more likely to know other tap dancers, and so forth. As a result, the number of overall nodes would be limited to individuals within the industry, increased only when random acquaintances are identified and included in the network map. While this is most certainly a gross generalization of the complexities that exist, it highlights a concern regarding both the continuation of dance artforms and inclusivity, the latter a current topic of deep interest within the community today.
These limitations, albeit inherent as they are to both data scraping and network mapping, should not be a discouraging factor when considering the merits of using these technological methods to visualize the history of the dance industry. Knowledge of programming languages, while helpful, is not always required to conduct research in this manner, thanks to several free online platforms that recognize how knowledge gaps create exclusionary barriers and provide simplified interfaces. For network mapping, these platforms include but are not limited to, Gephi, an open-source tool, and Stanford University’s Palladio, which can also consider geographical information (in the form of coordinates) within a social network. Each of these come paired with a large library of tutorials on how to structure, upload, and work with data sets. Additionally, numerous chat forums can be found online where users share information and workarounds for the occasional glitch. Should you have trouble getting programs like Gephi to launch properly, these forums offer helpful insights, such as small modifications to program code that are easy to follow and understand. For the dance industry, this is particularly useful as coding abilities can be limited in availability outside of webpage management and the occasional marketer who possess these skills. Dancers themselves have been known to take up coding as hobbies or side jobs but remain a part of the minority.
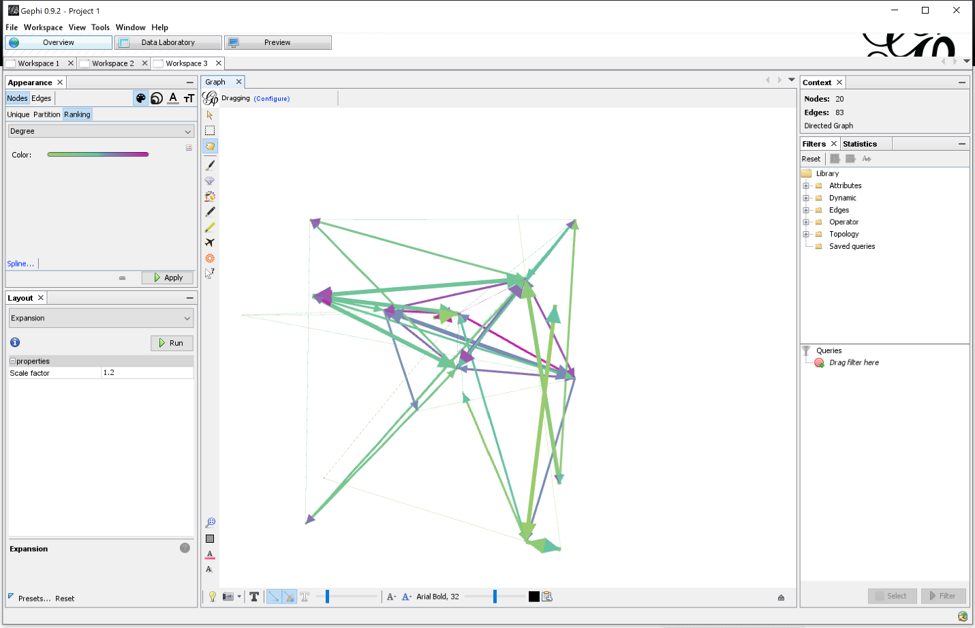
Figure 3: Screenshot of Gephi’s user interface in Overview mode while creating the network maps found above. It is here that adjustments to color, node position, edge weight, node size, community modularity, and much more can be edited prior to exporting finished visual (curved lines) from Preview mode . Source: Author.
There is one downside to using open source tools that are friendly to non-coders, particularly for network mapping: the time commitment needed for familiarization. Without the assistance of a coded program to pull specific types of information, users with little to no coding ability must designate substantial quantities of time to identify what they are looking for via dropdown menus and specific command functions that can initially be confusing. First-time users could easily get frustrated, leading them to wonder why they attempted to harvest data that way at all. To mitigate this, non-coding friendly platforms utilize basic programs that allow data to be identified based on what the user has selected and how such data was structured. Nevertheless, this is more efficient than harvesting data the old-fashioned way. With free, open-source tools available for anyone to use, creating a social network map of choreographers/notable teachers and people they influenced remains well within the realm of possibilities for an industry that has traditionally relied on oral and physical transmission of information.
Conclusion
Network mapping has incredible potential for the dance industry regarding inclusion and education. For the purposes of this paper, the inclusion desired here is not the same as the inclusivity advocated for through Diversity, Equity, Accessibility, & Inclusion efforts. This is a very small cog in a much larger and much needed machine, yet its focus is decidedly inward and considers how information is archived and hoarded between various factions within the industry, rather than the relationship between the industry and society. By taking time and effort to create an accessible and interactive network map that allowed individuals to trace back and dig deeper into the industry’s history, we could push past the tendency to broadly associate historical turning points to a few individuals and uncover the connections that made them possible. Students training in a particular style could identify similarities between genres that could help them better understand approaches to musicality or discipline. Dance historians might even be able to fill gaps that may exist within their own research about an individual, a choreographic work, or a specific company (e.g. Ballets Russes). “Research … is an important part of company life at every rank” and as archives have slowly been dusted off to meet the digital age, access to these materials has proven to be advantageous for many dancers and their careers (Dance Magazine). A social network map visualizing the complexities of the dance industry has endless possibilities.