

This is part 2 in a three-part series exploring the inclusivity problem in the video gaming industry. To learn more background and the state of the current industry, read part 1 here. For recommendations for building inclusivity in video games, read part 3 here.

Figure 1: Two people playing a video game. Source: JESHOOTS.com
As the video game industry is rapidly growing it is important for the industry to understand their player-base to ensure they are creating an equitable and inclusive environment. There is a current problem in the gaming industry content as many people feel alienated due to racial and gender representation. Not only is the gaming industry losing out on potential revenue because of this, but they are promoting a toxic playing environment.
This report presents research findings on the inclusivity problem in the video game industry based on a quantitative survey and professional interviews. The survey findings are presented below and four recommendations for strategies the gaming industry can use to combat this problem are explored in part III.
Survey
The survey was divided into four sections according to subject matter: Video Game Habits and Perceptions; Player Motivations; Content; and Community (a copy of the survey can be viewed here) The analysis adheres to the same structure. For reporting findings, “other” refers to statistically smaller groups, including Asian-American, Asian, Pacific Islander, American Indian, Native American and others which together make up 10% of the sample.
The survey was distributed by a group of Master of Entertainment Industry Management students from Carnegie Mellon University to 1,500 respondents, adhering to census-based demographic quotas.
Video Game Habits and Perceptions

Figure 2: Interest in subscribing to a cloud-based gaming platform by ethnicity. Source: Author
The Habits and Perceptions section was asked of the entire 1500-respondent sample and filtered participants into categories of (1) Active PC/Console Players (those who have played PC/console games within the past 30 days); (2) Lapsed PC/Console Players (those who have played PC/console games in the past but not within the past 30 days); and (3) Non-Players (those who have never played PC/console games). The gender ratio of active PC/console players skewed towards men, with approximately 62% male versus 38% female.
Lack of time and disposable income were expected to be significant deterrents to playing core games, which the data support. Time constraints were found to be the primary reason that gamers avoid or migrate from PC/console games. 47% of lapsed players indicated that they no longer actively play core games due to a lack of leisure time. Price point also proved to be a significant factor in influencing players’ choices; 31% of active PC/console players reported a belief that video games are too expensive. Among active PC/console players, 52% spend over $100 on hardware annually, and 6% spend over $500.

Figure 3: Interest in video game genres by gender. Source: Author
When asked about interest in subscribing to a cloud-based gaming platform with access to an unlimited library of top-tier games for a monthly fee, 57% of respondents expressed interest (27% highly likely and 30% somewhat likely). Among non-white respondents, interest was markedly higher, with 62% of Black respondents and 69% of Hispanic respondents indicating interest, compared to 53% of white respondents. This suggests high spending potential among minority groups.
As existing research suggests, genre tastes vary between genders. The genres with the highest variance between males and females were puzzle, sports, fighting, and platformer games. Female respondents indicated greater interest in puzzle and platformer games, with 46% and 19% respectively, versus 14% and 7% for males. Male respondents reported higher interest in sports and fighting games, with 34% and 25% respectively, versus 11% and 13% for females.
Awareness of specific core game titles varied significantly as well. In general, males reported higher awareness of core games than females. The largest gaps in awareness existed for PlayerUnknown’s Battlegrounds (24% of males reported awareness vs. 10% of females), Hearthstone (20% vs. 11%), Dark Souls (27% vs. 17%), and Apex Legends (23% vs. 10%). Of all 21 game titles included in the study, The Sims was the only core title with a higher reported female awareness than male (70% vs. 56%).

Figure 4: Awareness of core game titles by gender. Source: Author
Player Motivations
The Motivation section of the questionnaire asked Active and Lapsed Players (N=982) participants to select and rank their top five motivations for playing games. The most-selected motivations were: (1) to unwind and relax (65%); (2) to escape from reality (50%); (3) to stimulate my mind (48%); (4) to immerse myself in other worlds (29%); and (5) to compete with others (24%). Interestingly, the least-selected motivations were to be a part of a community (10%) and to make new friends (11%). This suggests that despite the central role that communities play in GaaS games, most players do not consider the community to be a key part of a game’s value proposition.
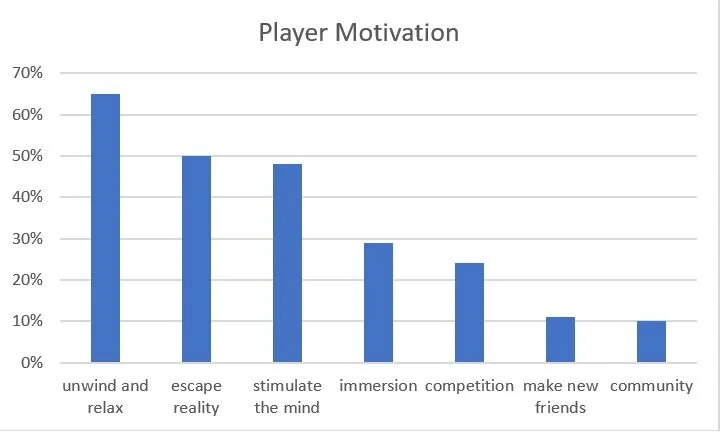
Figure 5: Player motivation by category. Source: Author
Game Content
The Game Content section was shown to Active and Lapsed players (N=982). First, respondents were provided 10 statements about games, both positive and negative, and asked which statements they agreed with. Across all demographics, respondents tended to agree with positive statements. For example, they selected that video games: (1) promote critical thinking and problem solving (59%); (2) teach teamwork and communication skills (52%); and (3) enable players to live out their fantasies (50%).
However, some demographic differences arose concerning negative statements. In terms of gender differences: 34% of women agreed that video games are overly violent vs. 17% of men; 33% of women agreed that video games disproportionately sexualize female characters vs. 15% of men; and 23% of women agreed that video games promote sexist/misogynistic attitudes and stereotypes vs. 12% of men. Regarding ethnicities, non-white respondents tended to agree that video games promote militaristic messages and themes at a higher rate than white respondents (23% Black, 23% Hispanic, 22% other, and 19% white).

Figure 6: Perceptions of video games by gender. Source: Author
When asked what factors are likely to discourage them from playing games, significant gender differences stood out. 29% of females selected violent content, vs. 12% of males; 29% of females selected an unwelcoming community or play environment vs. 19% of males; and 27% of females selected insensitive or problematic content vs. 17% of males.
Respondents were then asked if they believe that video games achieve appropriate and equitable gender representation. 60% of males answered “Yes” vs. only 40% of females; 18% of males selected “No” vs. only 21% of females; and, interestingly, 23% of males selected “Unsure” vs. 39% of females. This suggests that, though males and females selected “No” in similar proportions, a greater percentage of females felt a reluctance to outright agree that there was appropriate and equitable gender representation.

Figure 7: Percentage of players who think that video games achieve an appropriate and equitable gender representation, by gender. Source: Author
Finally, respondents were asked if they believe that video games achieve appropriate and equitable ethnic representation. 60% of males responded “Yes” vs. 46% of females. Differences also arose between ethnic groups. 55% of white respondents selected “Yes,” vs. 40% of Black respondents, 60% of Hispanic respondents, and 49% of other respondents. 19% of white respondents selected “No,” vs. 35% of Black respondents, 20% of Hispanic respondents, and 28% of other respondents.
Community
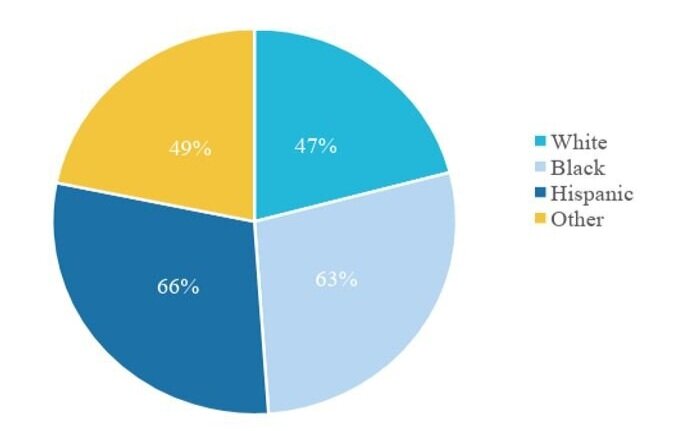
Figure 8: Frequency of online gaming over the last 30 days, by ethnicity. Source: Author
At the beginning of the Community section, all Active and Lapsed Players (N=982) were asked if they have ever played online multiplayer games. Community-focused questions were asked only of those indicating that they have played online games (N=685).
When asked about online gaming recency, frequency, and session length, non-white ethnicities indicated that they play both more frequently than white respondents and that their typical gaming session length is longer than white respondents. First, 47% of white respondents indicated that they had played within the past 30 days vs. 63% of Black respondents, 66% of Hispanic respondents, and 49% of other respondents. Next, 35% of white respondents indicated that they play online games at least once per day vs. 42% of Black respondents, 55% of Hispanic respondents, and 33% of other respondents. Finally, 20% of white respondents indicated that their typical session length is two hours or more vs. 24% of Black respondents, 29% of Hispanic respondents, and 31% of other respondents. This suggests that non-white gamers who play online games tend to be more engaged.
As one might expect, a greater percentage of males reported active online playership than females. 62% of males indicated having played online games within the past 30 days vs. 40% of females. Males reported higher frequency than females as well, with 42% of men playing at least once per day vs. 36% of women. Finally, when asked about their typical session length, 27% of men reported that they typically play for 2 hours or more vs. 17% of women, while more than half (57%) of women reported a typical session length of less than an hour. Indeed, men reported higher online engagement than women on all fronts.

Figure 9: Reasons for masking online identities while playing video games. Source: Author
Respondents were then asked if they had ever hidden their identity while playing online games. Those that responded that they had were then asked why they had done so. Women selected “fear of harassment,” “security of personally-identifiable information,” and “general desire for anonymity” more frequently than men.
Respondents were also asked a series of questions as to whether they have ever witnessed: (1) exclusionary or socially-unwelcoming attitudes, defined as non-targeted slur use, misogynistic attitudes, politically incorrect language, etc.; or (2) direct harassment, defined as targeted slurs or sexism, etc. For those respondents that answered affirmatively to the latter question, a third follow-up question was asked as to whether they had ever been the victim of such harassment. 66% of respondents indicated that they had witnessed exclusionary/unwelcoming attitudes, 49% of respondents indicated that they had witnessed harassment; and of those, 49% indicated that they had been the victim of harassment.
Clearly, a significant amount of harassment and toxicity exists within online gaming communities—so much so that non-online gamers’ perspectives are impacted. Those individuals who indicated they had never played an online game—approximately 20% of the 1500-person sample, or about 300 respondents—were asked why they had not. Of those, 42% answered that some form of toxicity or harassment served as the primary deterrent. This suggests that outside of gaming communities themselves, there exists a marked perception of these communities as being toxic.
Respondents were also asked about microtransaction purchasing frequency. Black and Hispanic respondents tended to purchase more frequently than white respondents. 22% of white respondents indicated that they purchase microtransactions once per week or more vs. 37% of Black respondents and 32% of Hispanic respondents.
Summary of Findings
The survey yielded somewhat different results than anticipated: differences between genders and ethnicities were not as pronounced as one might have expected. This may be because the questionnaire was fielded among a general population sample based on census data, so the sample contained relatively small minority base sizes.
However, some aspects of the questionnaire data were more aligned with expectations. Firstly, women agreed much more frequently that female game characters are disproportionately sexualized, with one in three women agreeing vs. less than one in six men. One female respondent stated that “female characters often have exaggerated features (large breasts and tiny waists) and dress provocatively in a way that doesn’t make sense for what they’re trying to accomplish.”
Likewise, community proved to be a problematic aspect of games. In terms of motivation, the fact that such a low percentage of respondents identified community as a key driver indicated that potential audiences do not see community as value added—at best, they may view it with indifference. At worst, it may be perceived as a hotbed of toxicity and harassment; this is supported by the fact that such a large percentage of non-online gamers chose toxicity and harassment as reasons for having avoided online gaming entirely.
Though the quantitative results did not paint as clear of a picture of core games’ inclusivity problem as theorized, when viewed in conjunction with qualitative research, the issue is more apparent. The industry professionals interviewed in this study provided a great deal of insight about this problem, and heavily informed the recommendations that follow.
Potential Revenue and At-Risk Revenue
The overall goal of this research was to estimate the potential revenue the industry is currently missing out on and the revenue they are putting at risk by failing to address issues of problematic game content and toxic communities. Survey respondents who had indicated that they had ever played games were asked if they had ever played online games. Of the 982 respondents, roughly 30% said no. Of those, 42% reported that they were deterred from playing due to toxicity and harassment, which was broken down into three categories: social toxicity (e.g. casual slur use, politically incorrect behavior, exclusionary attitudes), harassment (e.g., targeted sexist or racist comments), and general toxicity (e.g. poor sportsmanship). Projecting this figure onto corresponding U.S. census population data suggests that the game industry could be missing out on approximately $2.2 billion due to a perception of online gaming communities as toxic. It should be noted that removing the “general toxicity” responses from the calculation still results in missed revenues of $1.4 billion per year.
Interviews commonly suggested that games already attract significant amounts of women and minority players. As such, it is also important for industry stakeholders to recognize the amount of revenue generated by these audiences. Projecting reported average microtransaction spend from different demographic groups onto corresponding U.S. Census population data suggests that Hispanic, Black, and “other” demographic groups generate roughly $4.9 billion per year. The same process suggests that women generate approximately $3.7 billion per year. These calculations do not account for other sources of game industry revenue such as hardware, software, or subscriptions, given that this study focuses on players who are fully engaged in GaaS ecosystems. Considering such significant amounts of microtransaction revenue, the game industry must consider their diverse players’ experience as they continue to grow or risk losing consumers, and therefore revenue.
About the Authors
This analysis was part of a capstone project by CMU Master of Entertainment Management Students: Mingyu Bian, Carina Carbetta, Olivia Green, Dan Hoyt, and Joan Rodriguez.