

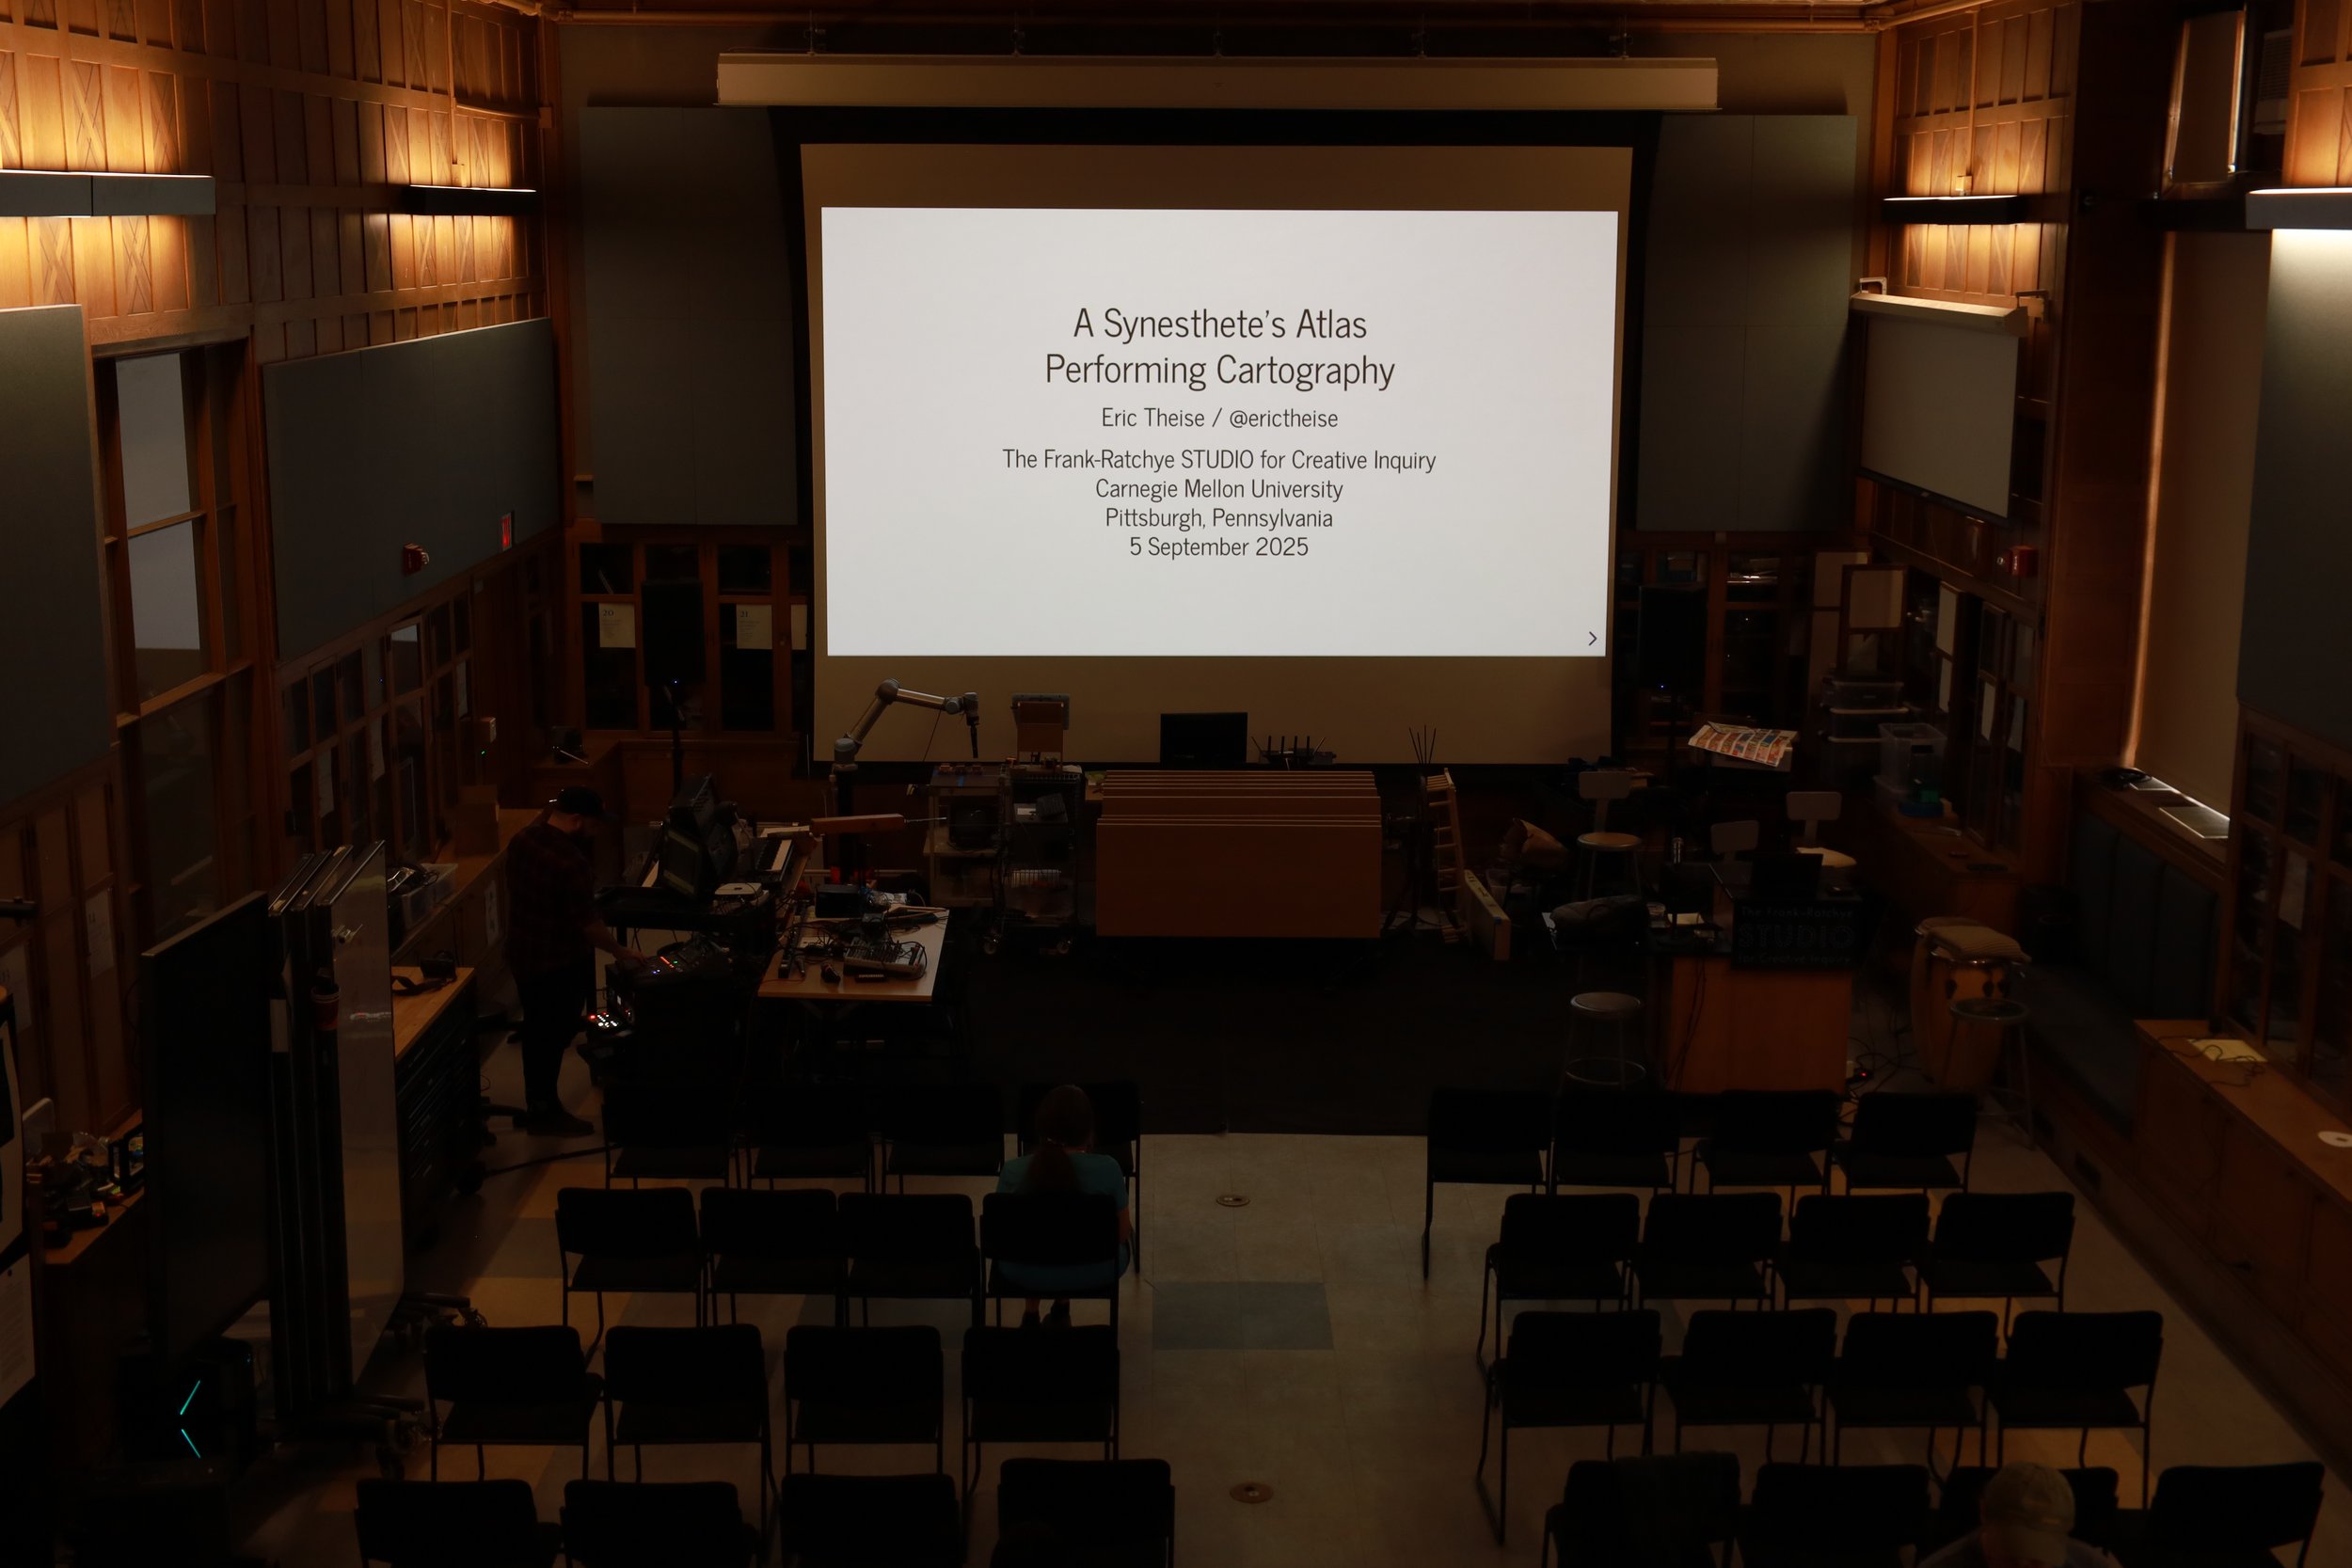
Eric Theise is a geospatial engineer, filmmaker, and performance artist. On September 5, 2025, he shared “A Synesthete’s Atlas” Performing Cartography, in an artist talk at the Frank-Ratchye Studio for Creative Inquiry at the College of Fine Arts. AMT Lab’s Co-Chief Editor, Nate Xiang, attended while I spoke with Eric immediately after his presentation. The photos below are from the event, taken by Nate, while the transcript from Eric’s and my conversation immediately follows.
INTRODUCTION
Eric Theise, who was born in Chicago and now lives in San Francisco, is an artist and a geospatial software developer.1 His work involves both moving and still images.2 He has experience working with 16mm film, with and without a camera.3 His current project, a born-digital series called If Maps, uses the tools of digital cartography to explore artistic concepts.4
Theise's artistic practice combines elements from experimental film and animation, color theory, the Light and Space movement, and concrete poetry.5 He uses open data and open-source software to create digital maps that behave in ways not intended by their original developers.6 He often uses these maps in live, collaborative performances with improvising musicians, a series he calls A Synesthete's Atlas.7 He has performed this show in numerous venues across North America and Europe since its premiere in Lisbon in 2022.8
In his professional career, Theise is a freelance geospatial software engineer.9 He was previously an academic, having earned M.S. and Ph.D. degrees in Operations Research.10 He has given presentations and workshops on a variety of subjects, including cartography, historical photographic processes, and digital literacy.11 He has also served on the boards of Canyon Cinema and the San Francisco Cinematheque.12
He has received grants from the Interbay Cinema Society, BAVC Preservation Access Program, and the Film Arts Foundation.13 His work has been featured in artist residencies at Signal Culture, The Fine Arts Museums of San Francisco, and Anchor Graphics.
INTERVIEW
Dr. Brett Crawford: So, is this the first time that you were able to come and perform at Carnegie Mellon and work with students and the staff at Studio?
Eric Theise: Sort of. One of the things that I'm able to do, which is fun, because of the nature of my work, I often find either a geography or cartography or a web-based conference where I can talk about the technical aspects of my work. Then I schedule a performance that night there, and I'll build a tour around that.
So I’ll find cities leading up to that, and cities leading out of it. In a good situation, I’ll get maybe eight cities out of one kind of conference. The North American Cardiographic Information Society had their conference in Pittsburgh a few years back, and so I did that. I actually started in Portland, Maine, worked my way down to D.C., came over here, and did a performance. The same guy who organized my Saturday night performance this year was Steven Haynes, who arranged something here. So I did perform in Pittsburgh before, but what’s funny is, in my days after the performance, I was just wandering around campus anyway. I met Harrison, sort of made that connection, and followed up with him when I found out that I was touring again.
Dr. Brett Crawford: I’m glad that you reached out and let them know that you were going to be here, because I was suspecting that Harrison would’ve been at your actual event. But I’m glad it all worked. You were also engaged not just in performing at the Studio for Creative Inquiry, but did you work with some students in classes as well, or did you just have open workshops for students?
Eric Theise: It was really just the lecture.
Dr. Brett Crawford: And I know you had the additional performance in Pittsburgh as well.
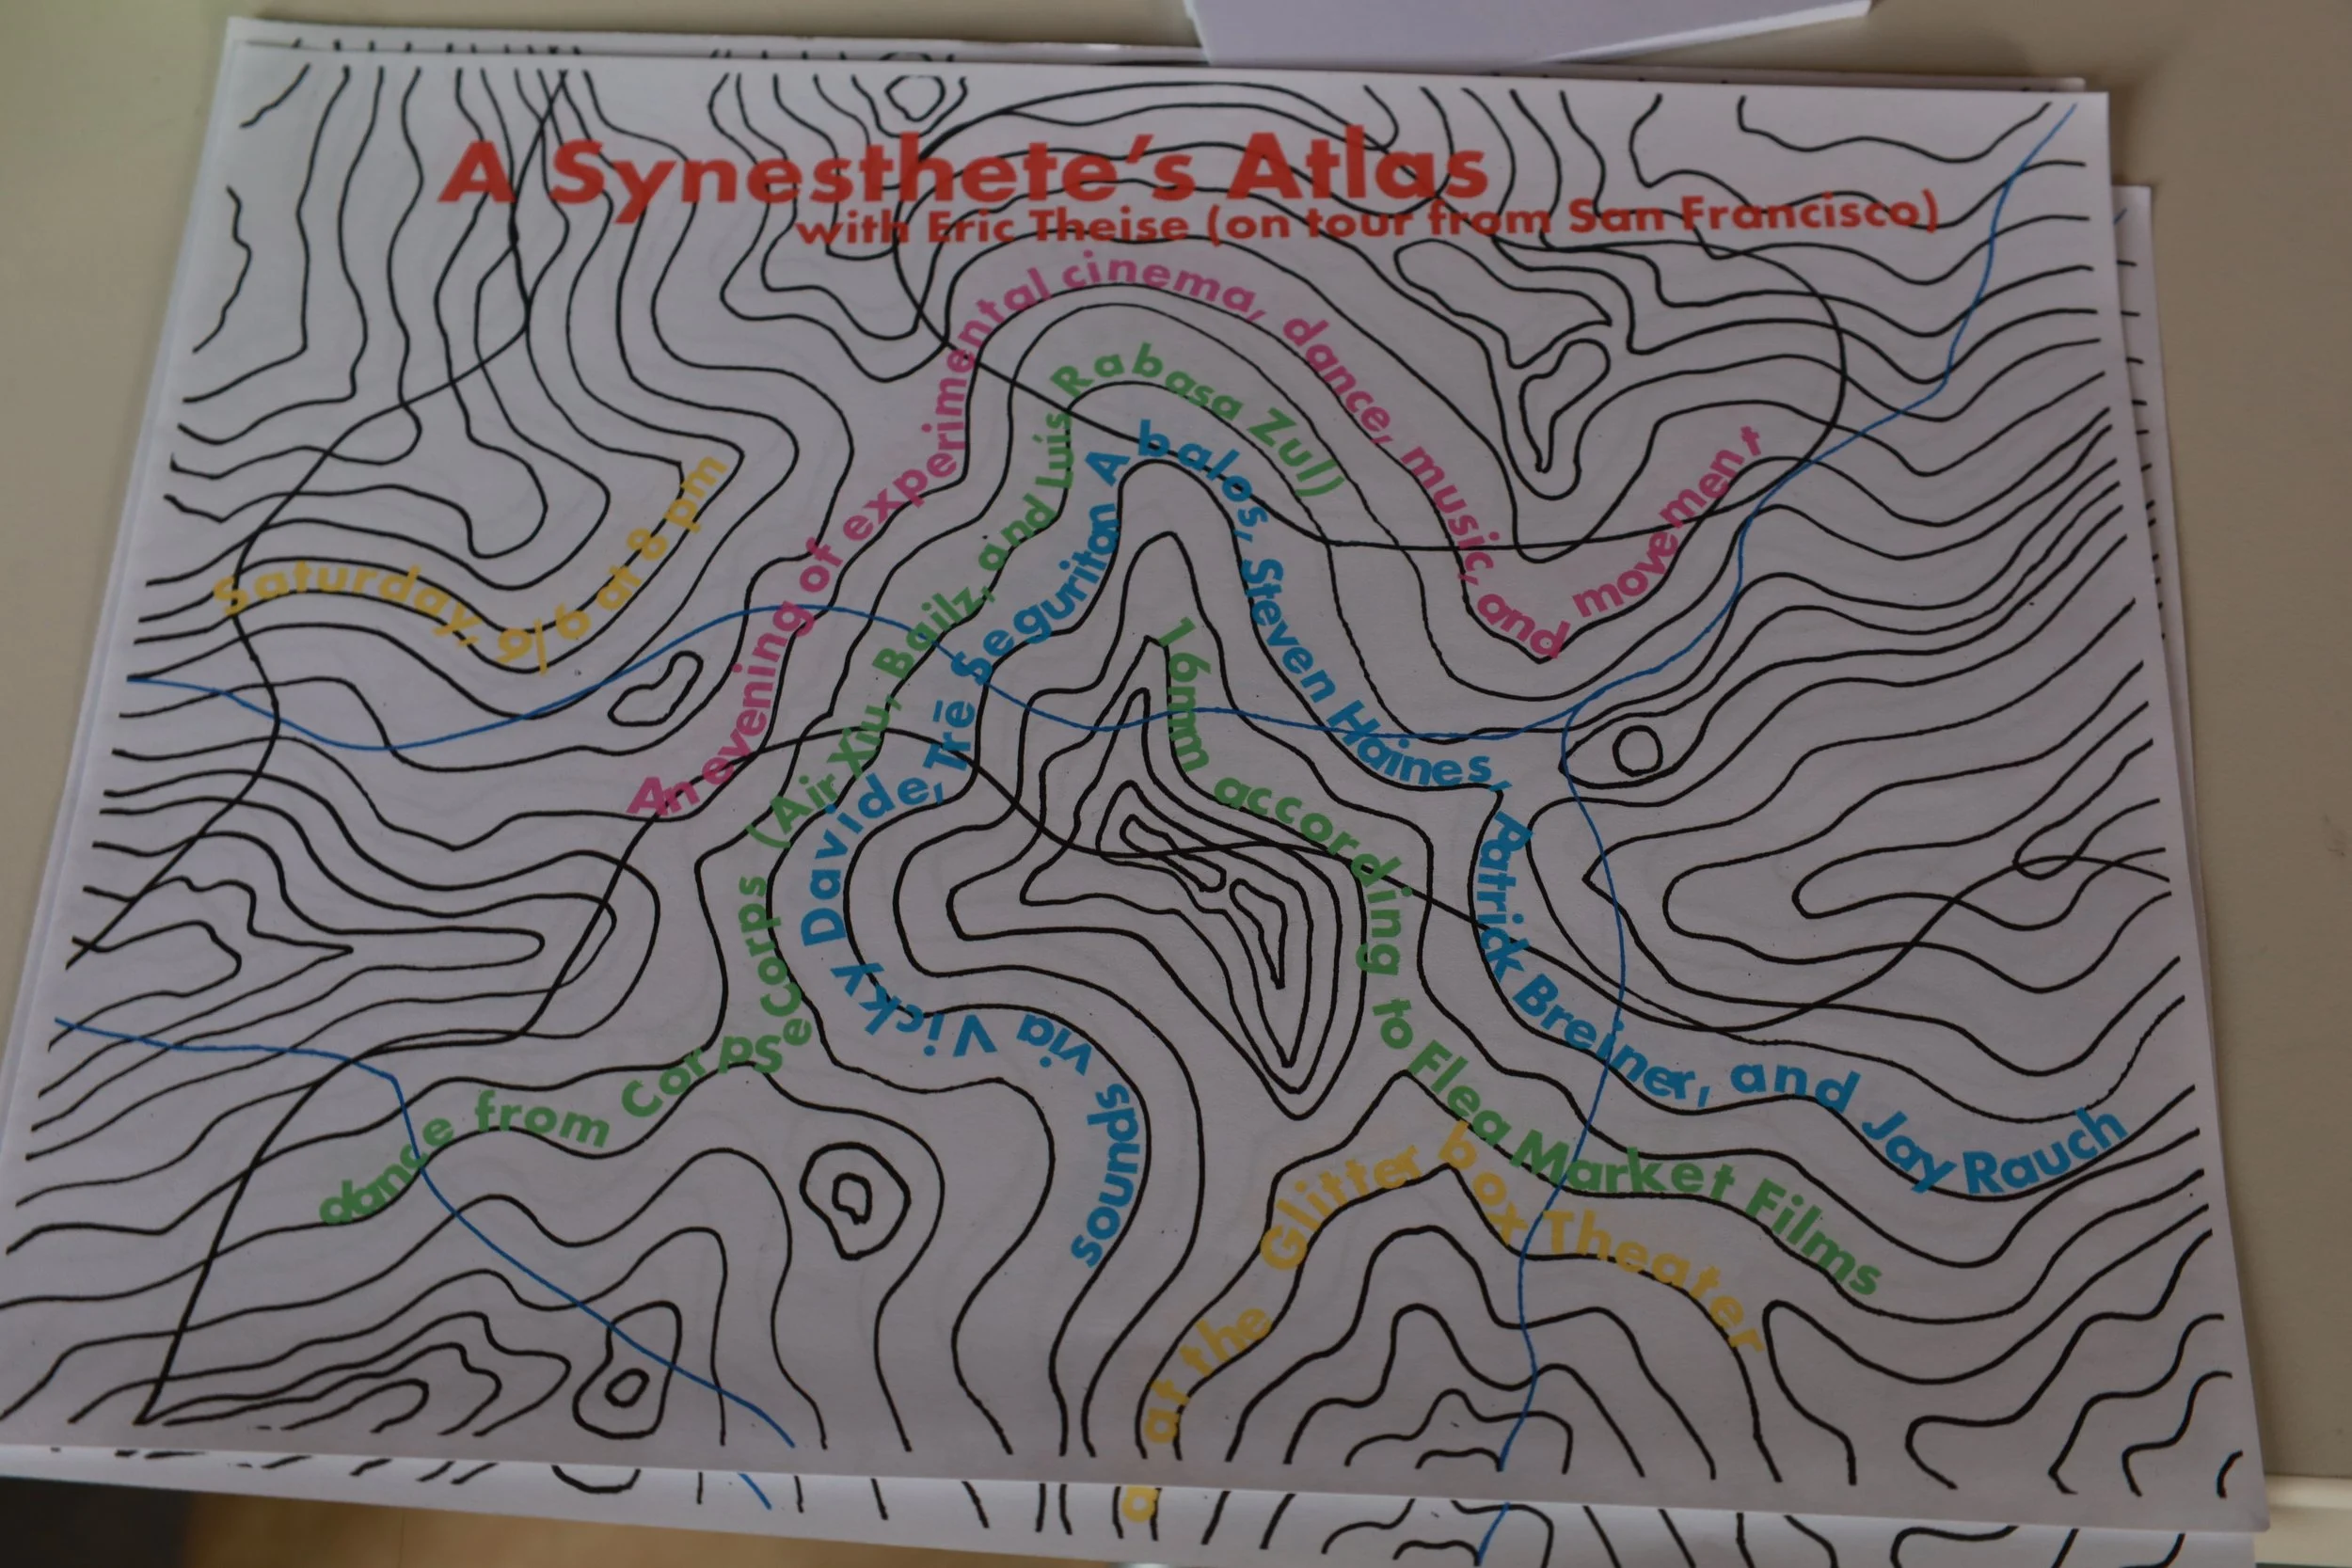
Eric Theise: Yes. On Saturday night, I performed at the Glitter Box. Steven Haynes again arranged that. Steven’s involved with a few things, but he runs Pittsburgh Sound and Image, and I know Flea Market Films.
Dr. Brett Crawford: I know the first, not the second.
Eric Theise: What’s funny is that there was an event, he did an event Friday as part of Pittsburgh Sound and Image, which was documentary work by a local filmmaker. It sort of seemed like she should have been in the Flea Market thing, because it’s just a, I mean, not just a documentary, but it wasn’t really pushing it with sound and image, and what I do kind of pushes it with sound and image.
Dr. Brett Crawford: I appreciate you taking the extra time to come do this podcast with the Arts Management and Technology Lab. We have been doing research and engaging with artists for the last 13 years, and sharing those stories, and, you know, forging more connections, is really the point of it all.
We attempt to work at the intersection of arts management and technology, all of these together. I listened, and I did some research on your work and watched some of the videos that you have on your YouTube.
And I was like, oh, you are, you’re nailing that sweet spot, right at the bullseye, because you come to this with a very unique experience. I mean, you’re still a freelancer who’s doing software, geospatial engineering. And then you’re also an artist and a filmmaker, and also a photographer.
Eric Theise: I mean, I do photography as a separate branch.
Dr. Brett Crawford: You're a multifaceted artist, but also a multifaceted engineer creating sort of an ecosystem career for yourself, which is amazing. And you have a PhD in operations research.
Eric Theise: Yeah. I started my career teaching that stuff. My relationship to that field is more quantitative than behavioral.
Dr. Brett Crawford: So what you did here was focusing very much on the geospatial mapping process. And, you’ve created your own software.
And you are attracted to maps. I am passionate about maps. I like those old maps too. I’m often looking for better ways of getting places, but they’re also beautiful, and I love the history of maps. What attracted you to maps, and what made you think, oh, this is it?
Eric Theise: Well, this is it. When I was young, I took a battery of aptitude tests, and one of the things that came back was cartography. Of all the childhood games that I had, the only one I really kept is a jigsaw puzzle, which is a map of the United States, which is where I learned my capital cities. So I think I’ve always been interested in maps.
What really kind of set me down this path was, I had a sculptor girlfriend who was trying to put together a course proposal with another sculptor about mapping at the California College of the Arts. We were talking about it over breakfast, and it basically seemed like they were too similar, and they weren’t really getting enough spark to the class proposal.
And I was, you know, maybe you could do this, or maybe, you know, you could approach it this way, or have a guest speaker do it. And she said, maybe I should teach this class with you. And I said, okay, let’s try that. And it was intended to run once, and it ran for four years.
So it was a successful class. CCA had, or maybe still has, a program where they would accept outside proposals as long as you can make a case that it would be interesting for at least three disciplines.
So this mapping class had, you know, information designers who wanted to make maps that actually communicate. We had painters, we had historians, we had people who worked in textiles and fashion, and we had architects. So the critiques were unbelievable. The critiques were really quite amazing to see, you know, the painter who’s trying to do the opposite of what an information designer would do, and to have them watch them talk about it.
Dr. Brett Crawford: And create new meanings between the conversation as well.
Eric Theise: So after doing that, she kept the 3D part, and she kind of worked with subjective and non-linear approaches to maps. Like, she was the one who talked about divining as mapping, whereas science fiction is mapping. And I put on my engineer hat and was like, 2D, this is how you do a survey. You know, very formal and sort of the history of cartography.
We took these exaggerated, not really opposing, but different positions in the way we taught the class, which was a lot of fun. But it was so much work that when I was done, I was like, I can’t just let this go. I’ve been doing web development since the beginning, so I just like to focus on what apps from here on in.
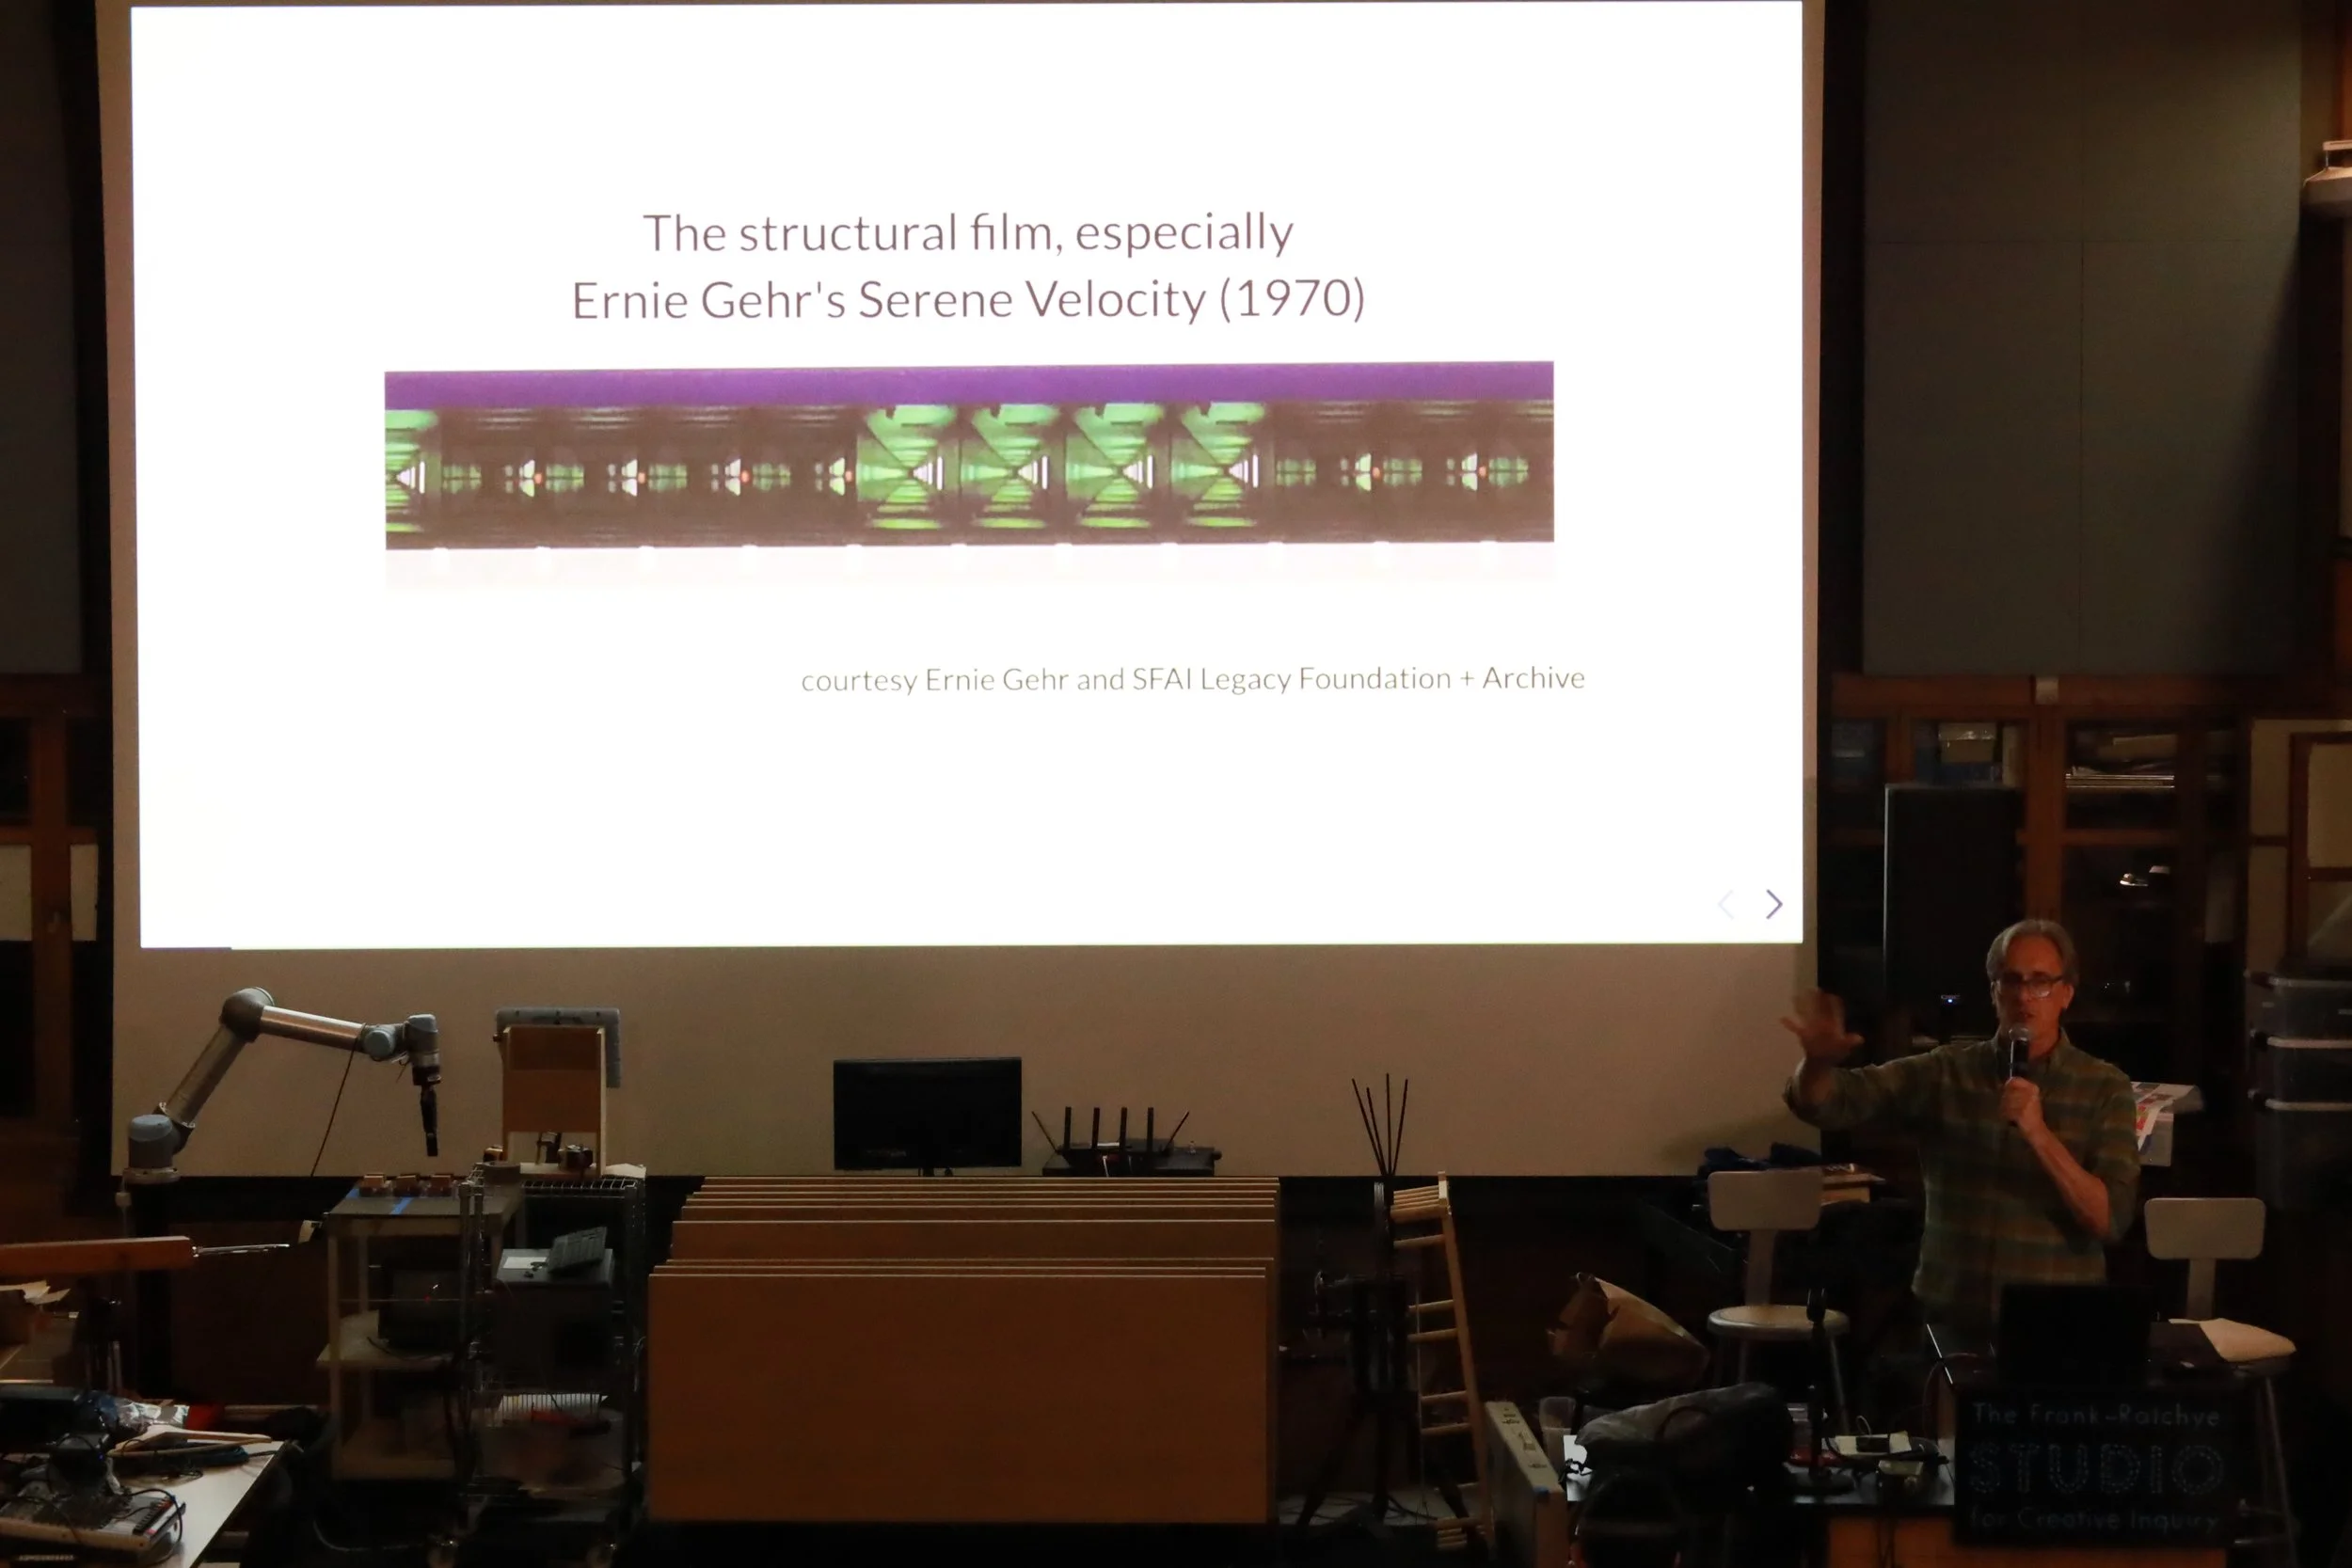
So that’s what happened to me professionally. I had created experimental films and have been interested in experimental films since I was probably an undergraduate. And, you know, 16-millimeter filmmaking is expensive and not very forgiving. And the things that I was interested in doing required just too many different skills.
And one day I just kind of realized that I could do experimental work using the map technology I use in my day job. So that’s where this project was born—really was that realization.
Dr. Brett Crawford: So you, this particular project, the Synesthete’s Atlas, is a series, it seems. As you’re building your data architecture around this series, how are you seeing it growing and developing? I guess sort of that arc just for that series. I know you do other work as well, but let’s focus on this one.
Eric Theise: I tour this, I find a venue that will have me, and then I find musicians to work with in that city or town. And so each of these is really kind of an entry in this atlas, you know? The instrumentation of the artist, the relationship we have during the performance, things we talk about in advance of the performance, like how they think about geography, other locations that trigger them in some way that would alter their playing. And then my own development. I give a performance, and I think at the end of it, I think of things I wished I could do.
And so, you know, to get technical, I opened a GitHub issue for myself. And so I have my own software tickets for bugs or features I want to add to my software. There are like 20 of them there now, but I knocked a few off for Saturday’s performance.
Yeah, so that’s kind of how the project grows. You know, the software becomes more capable, I have become more practiced with it, and I’m always working with new instrumentation. On Saturday, we had two clarinet players, two flute players, and some electronics. And then, the way Steven set it up, there were dancers. So the dancers joined for the final set.
Dr. Brett Crawford: I imagine that it also gets really interesting as you, as an artist, when you add more than two other artists to the mix.
Eric Theise: Yeah. I started off the first performance of this in Lisbon with a cellist, you know, and it was very much a, you know, I want to listen to what she’s doing, and she’s watching what I’m doing. And it just seemed like I had fewer variables. Most of the performances have been duets or maybe trios.
But before I came here, I did a show in Columbus with a quintet, which worked fine. The first dance was in Oakland. It was closer to my vision because they were in the beam and wearing light-colored clothes, and some of the colors really popped on their faces as they turned around or on their backs.
What I do is really kind of unique and kind of weird, but, you know, people like it, and I like it, and the performers like it, so there’s something to it.
Dr. Brett Crawford: Absolutely. And it's very ephemeral, which is also part of the excitement in doing it. My mind took me back to your original class and your girlfriend at the time, and by adding the dancers, you're making it sculptural.
Eric Theise: I mean, one of the comments was that even though the dancer was moving relative to the movement of the map, she was fairly stable, and it kind of anchored the performance in a way that they hadn't seen before. Even though she was moving around and still kind of fixed the room in a way.
Dr. Brett Crawford: That's really interesting. I'll look forward to seeing the video of that. So we have a map focus in some of the research we do, a different form of geospatial analysis. And, we have GIS classes.
In your cartographer practice, are you also creating visualizations of all the places you’ve performed in and the different experiences, along with some other more two-dimensional or three-dimensional stories?
Eric Theise: I did realize recently that I should have a map of where I’ve performed on my website. But apart from that, my software allows me, like if I go for a walk, and I’m running Strava or something on my phone, I can download the GPS trace of my walk and play it back in the software.
So, one of the pieces we did Saturday was a composition by Vicki David, who was a flute player, and she did a piece called ODE to Pittsburgh Urbanism. I believe that is what it’s called. There are a number of field recordings from various places that she went.
We were emailing back and forth about it the day of the show, really, I think, or the night before and the day of. She sent me the recording so I could hear them, a link to locations, which turned out to be a map, which turned out to have a GPX export. So I actually was able to download her walk, where she had made all these recordings, and that was the basis of the maps I used.
So it was very, absolutely, Pittsburgh-focused in that section and related very directly to where the sounds were coming from. So in the software, how does place translate in terms like, and obviously it’s multilayered, but how, in your description for our audience, does Pittsburgh sound, or I guess it’s really through the sound as it’s the look?
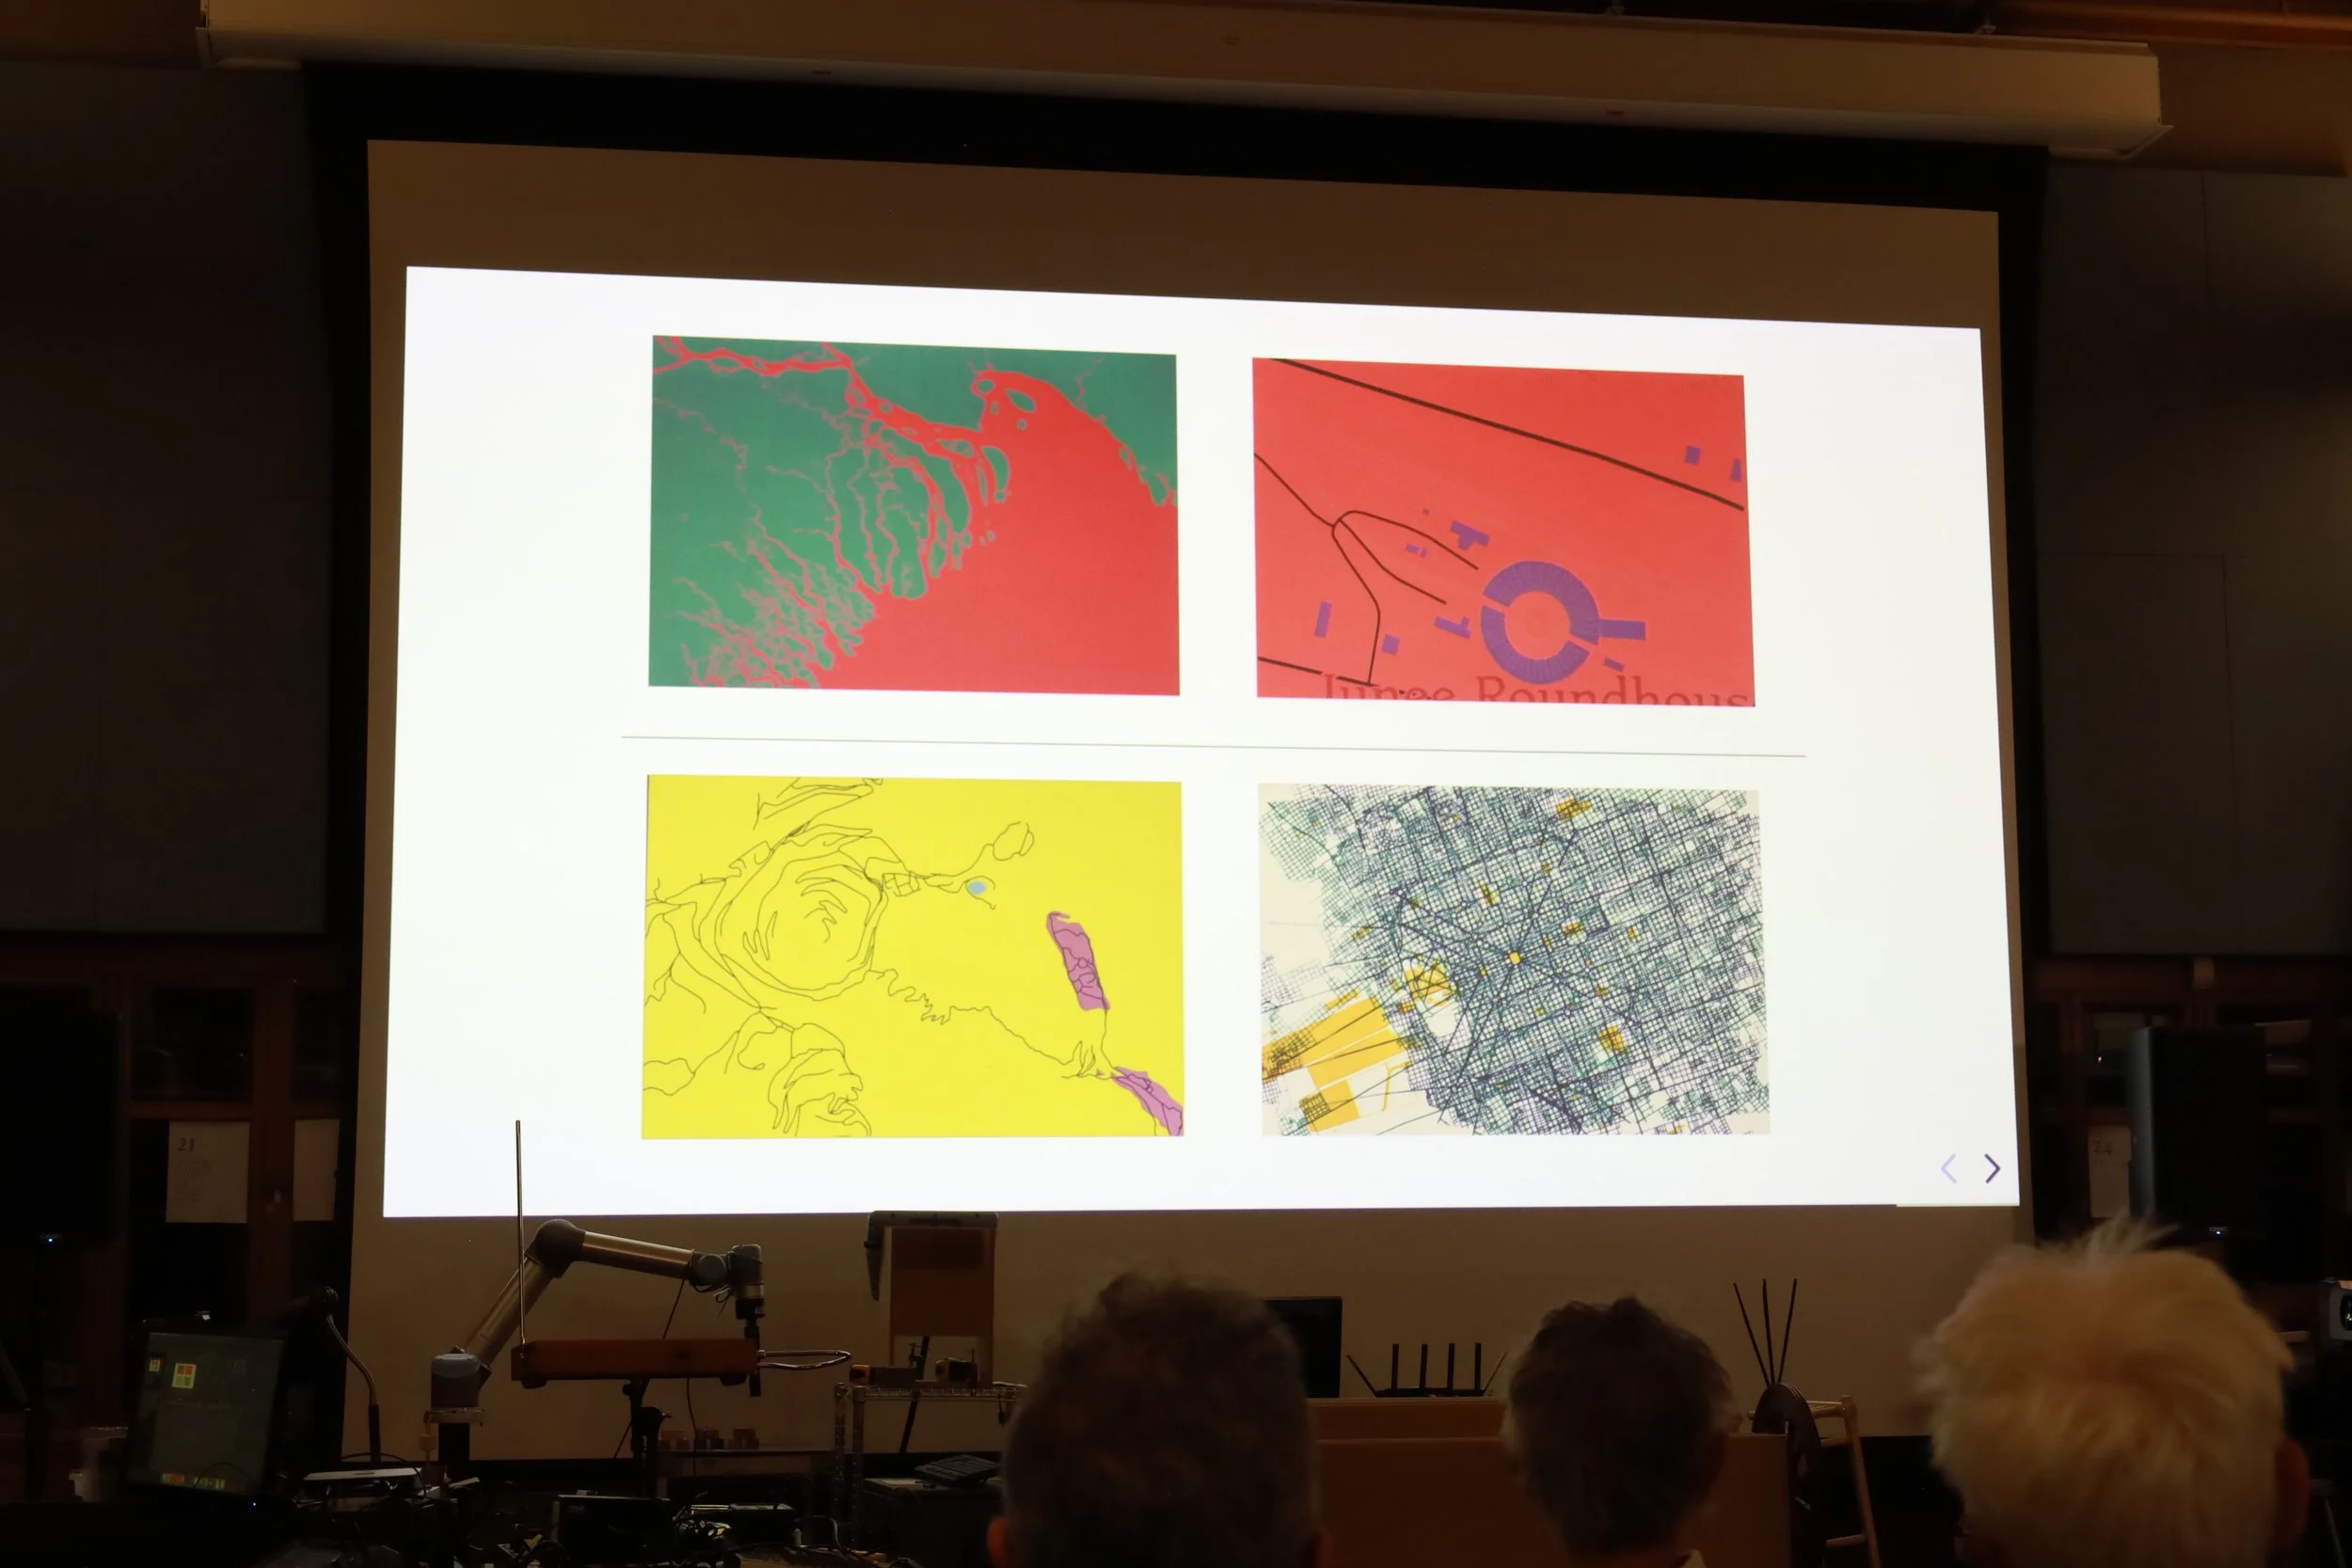
I mean, I don’t know. If somebody hasn’t done a dissertation on SCF, they should, which is like, what are the finger gestures people do to make a map of their town? So, like, Vicki did this. The rivers come together, and, you know, people from Michigan do a thing with their hands.
So that’s what Pittsburgh looks like to me from now on, it’s like this V gesture. And just say that the software I use has a number of locations that I can call up, either fly to in the way that a map zooms up and comes down, or just jumps abruptly like a jump cut.
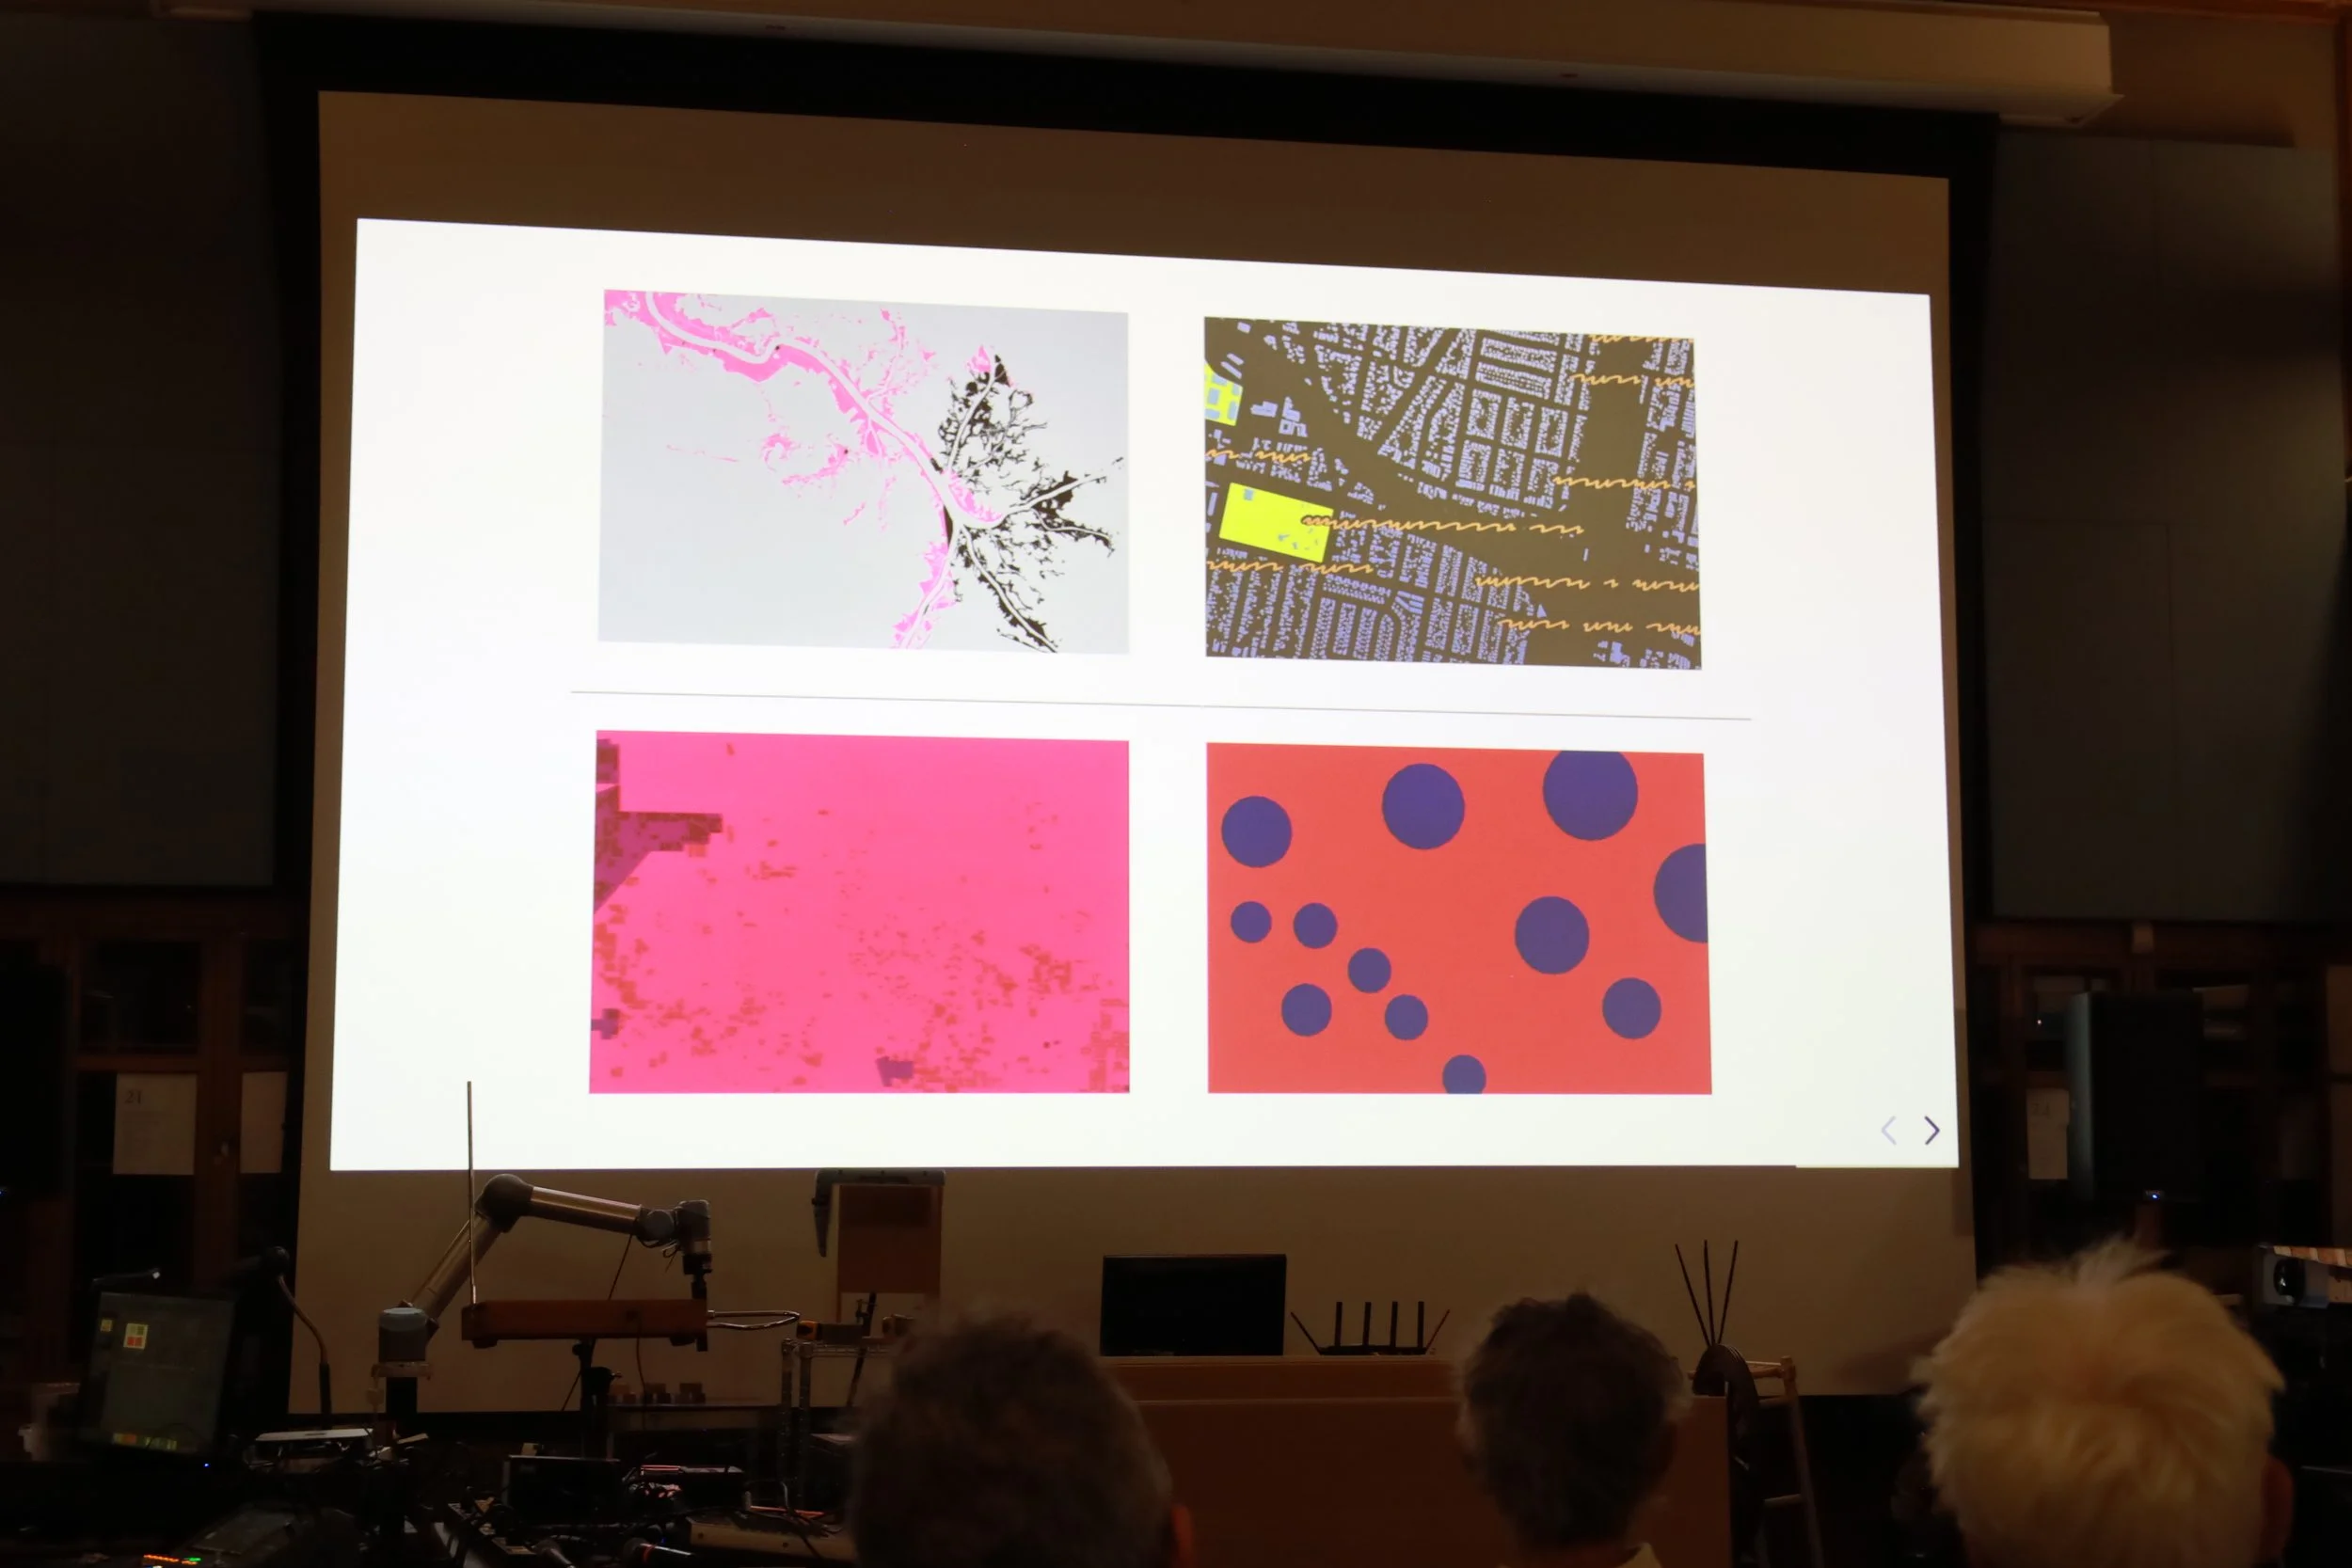
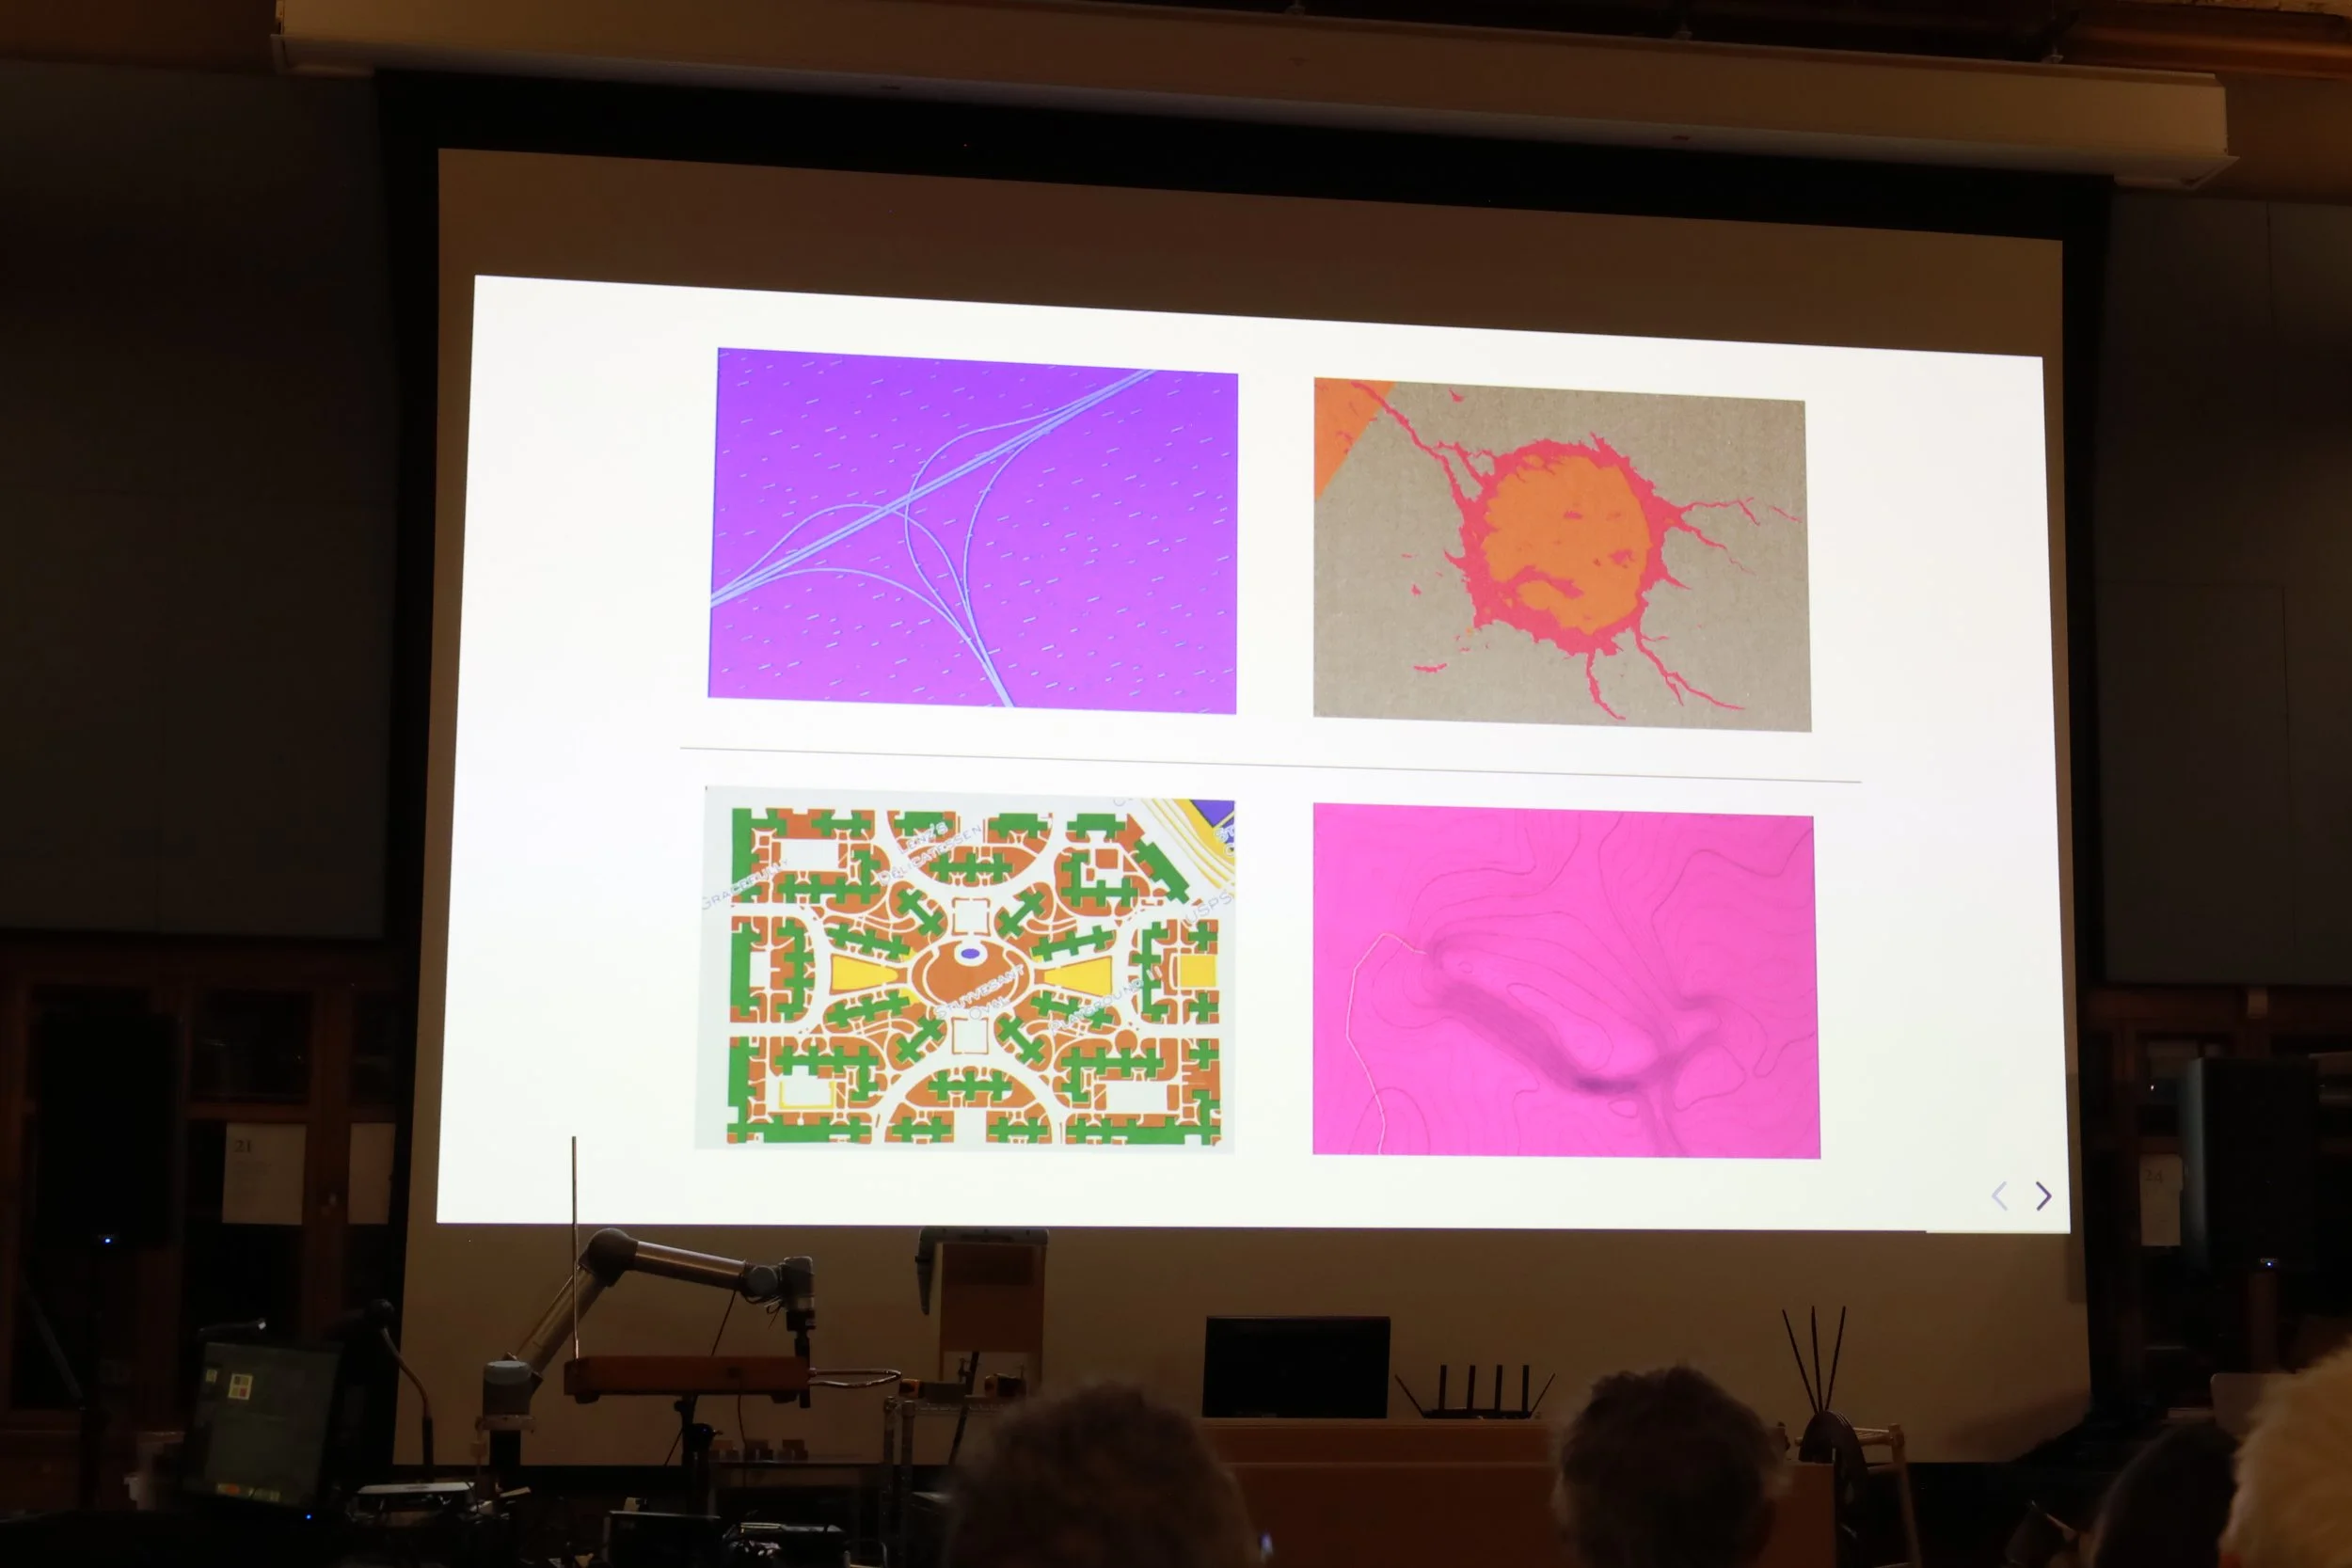
There’s a quintessential example: the capital of Argentina, I think, is La Plata, which is a very rigid grid. All streets are numbered. It’s very formal, very objective, very efficient, and quite beautiful. But, you know, it’s not a spider web, but it’s just a very gritty thing.
And then there are medieval cities, cities in Sicily in Italy, places in Europe that are hexagonal or octagonal. But then there are also river deltas, coastlines, or archipelagos that are very organic and very fluffy, and a little unclear what they are.
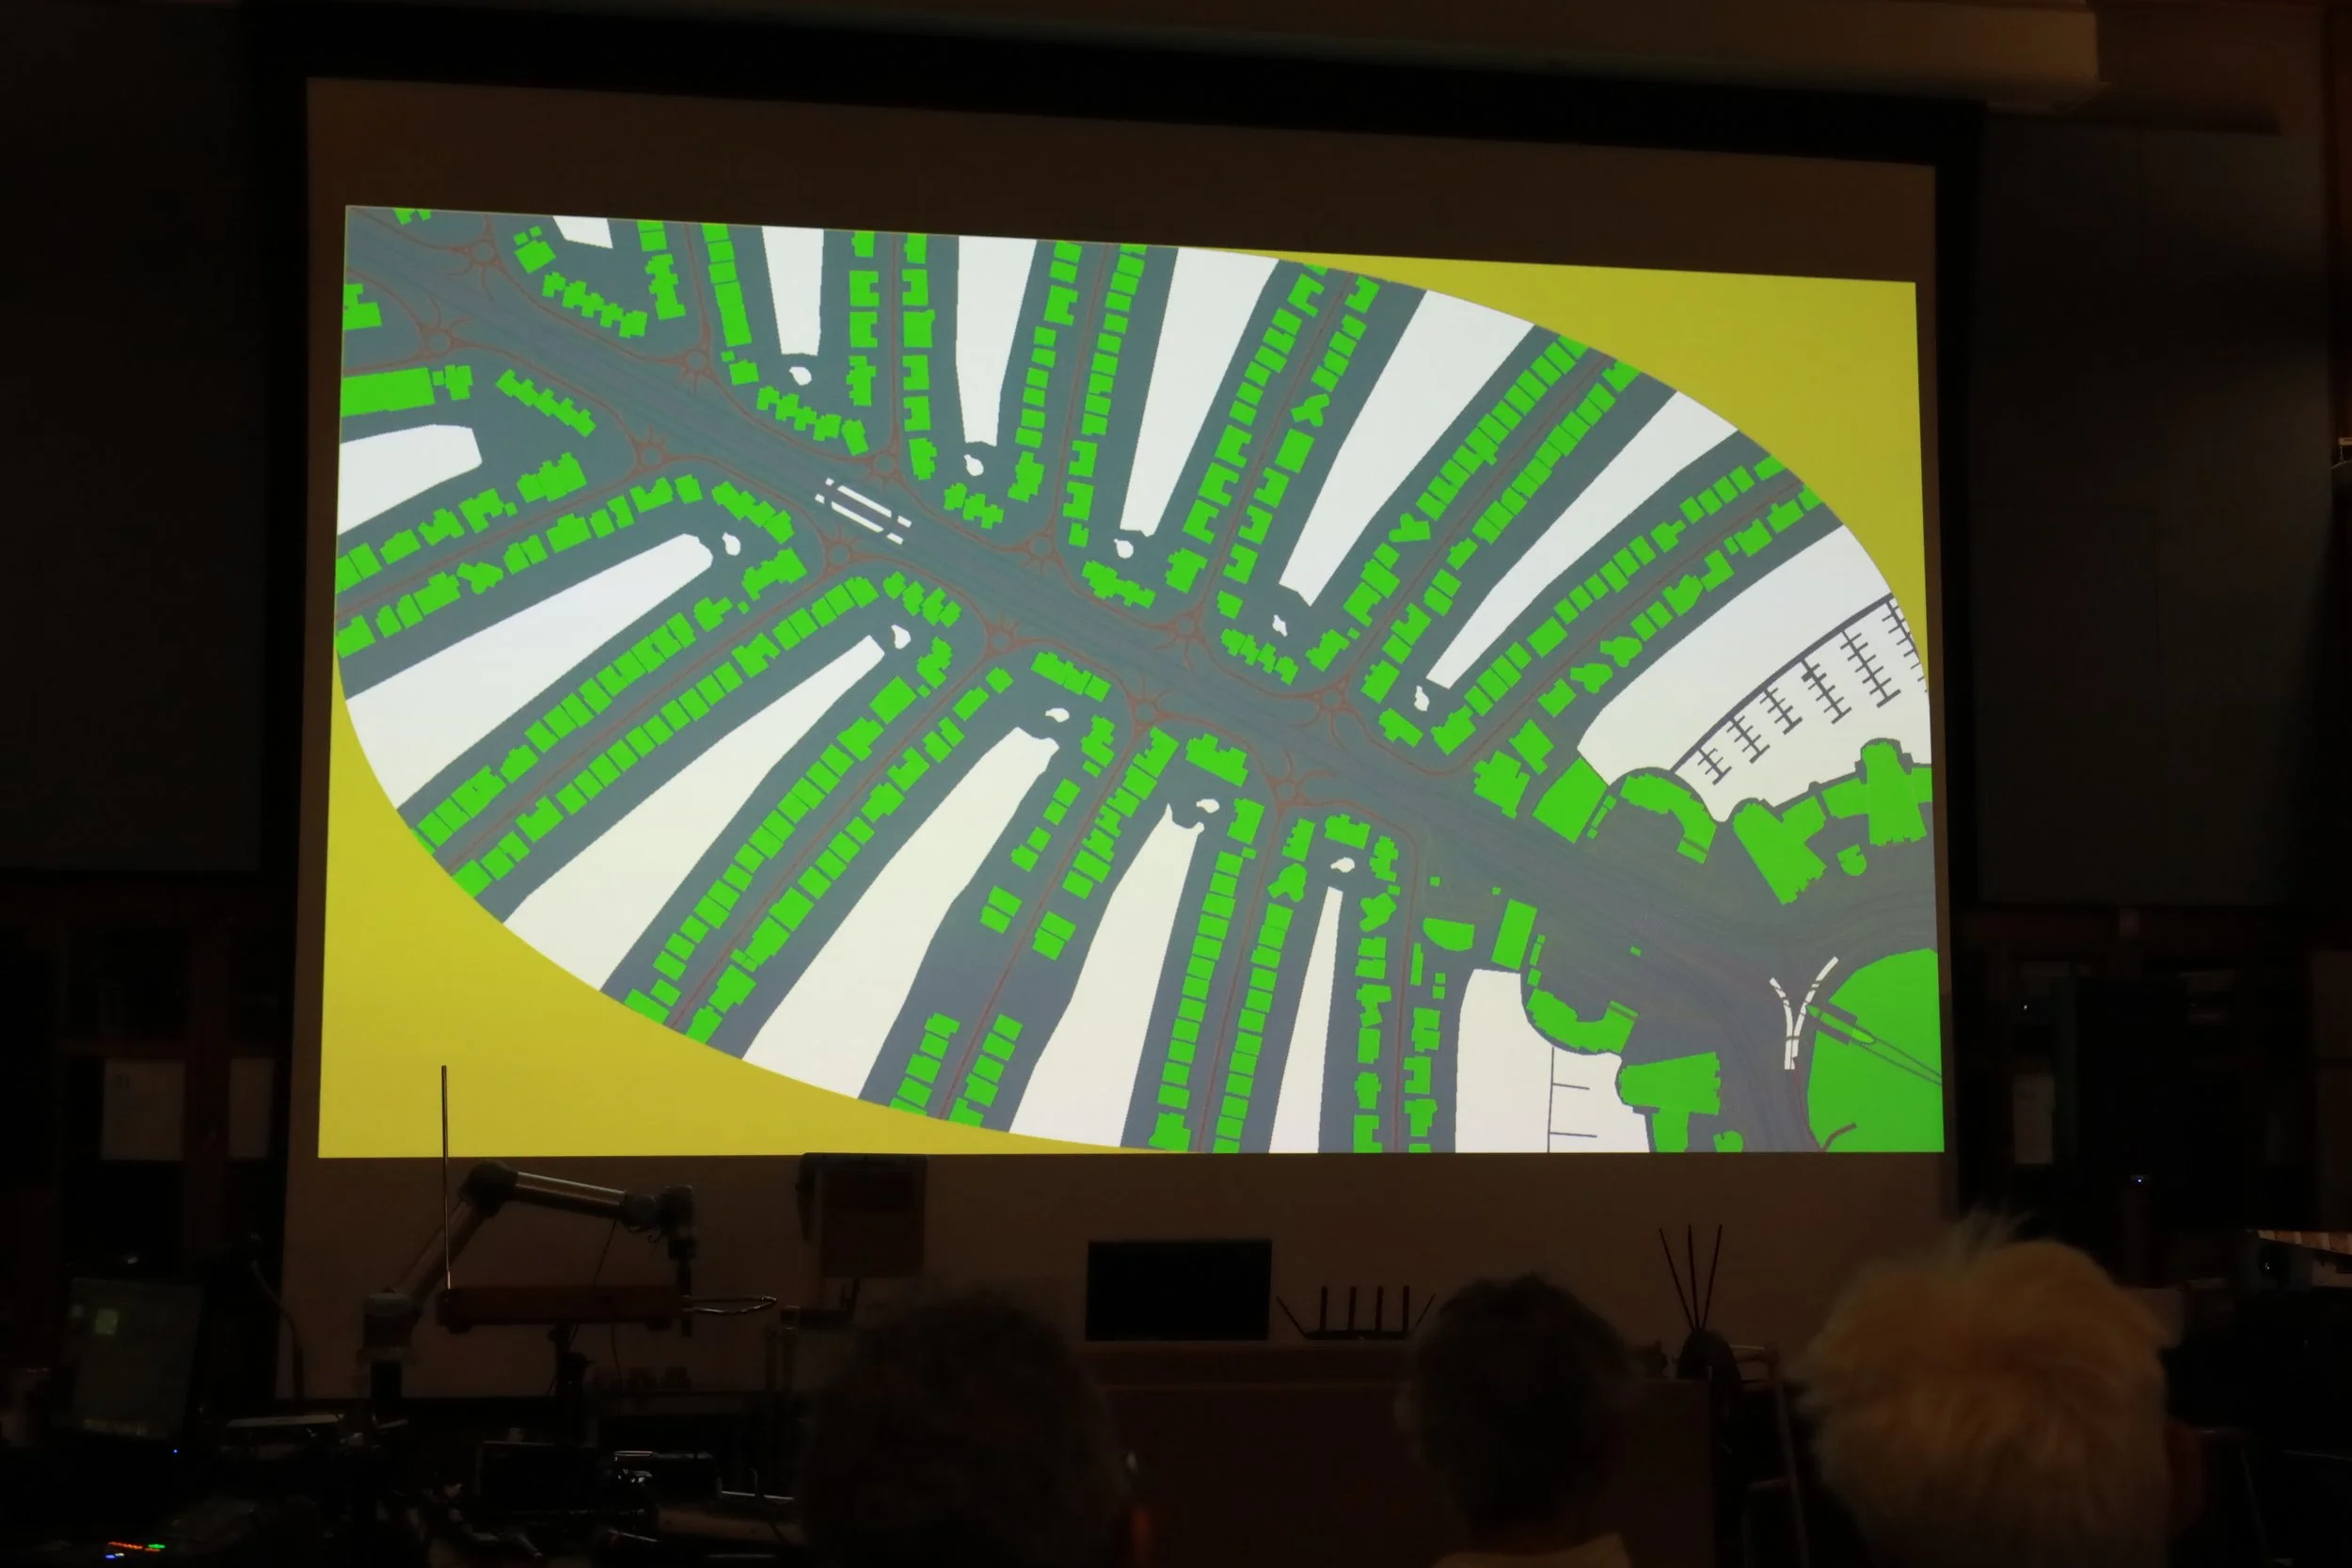
It does act a lot like a GIS system in that when I’m changing the color of something, I’m addressing a water layer or a road network layer or a train network layer, or something that’s coded for land use, or just exposed earth or water.
So yeah, there are these patterns: man-made categories placed on a natural environment or a built environment. It’s sometimes surprising when you fly to one of these places and see the patterns. The Great Basin has a lot of cloudy, amorphous shapes, and it’s quite abstract if you don’t know what it is. And if you get rid of the roads, it’s just these patterns, like clouds or something.
Dr. Brett Crawford: I think that will help the listener visualize some of the ideas that you have. So you mentioned your tech stack, can you sort of talk through that?
Eric Theise: My work is based on a number of libraries.
The thing that shows the map in my performance is a web browser, Chrome, the Chrome around it, but you see the screen. There’s an open-source software project called MapLibre that makes the map. The data all comes from the OpenStreetMap project, which is the Wikipedia of geographical data. Anybody can contribute and fix it.
Dr. Brett Crawford: I've worked with OpenStreetMap for other projects,
Eric Theise: It’s fantastic that, you know, the licensing is very liberal. It allows me to do this in a way that I couldn’t with anything else. Like, it would just be too expensive or impossible to do it any other way.
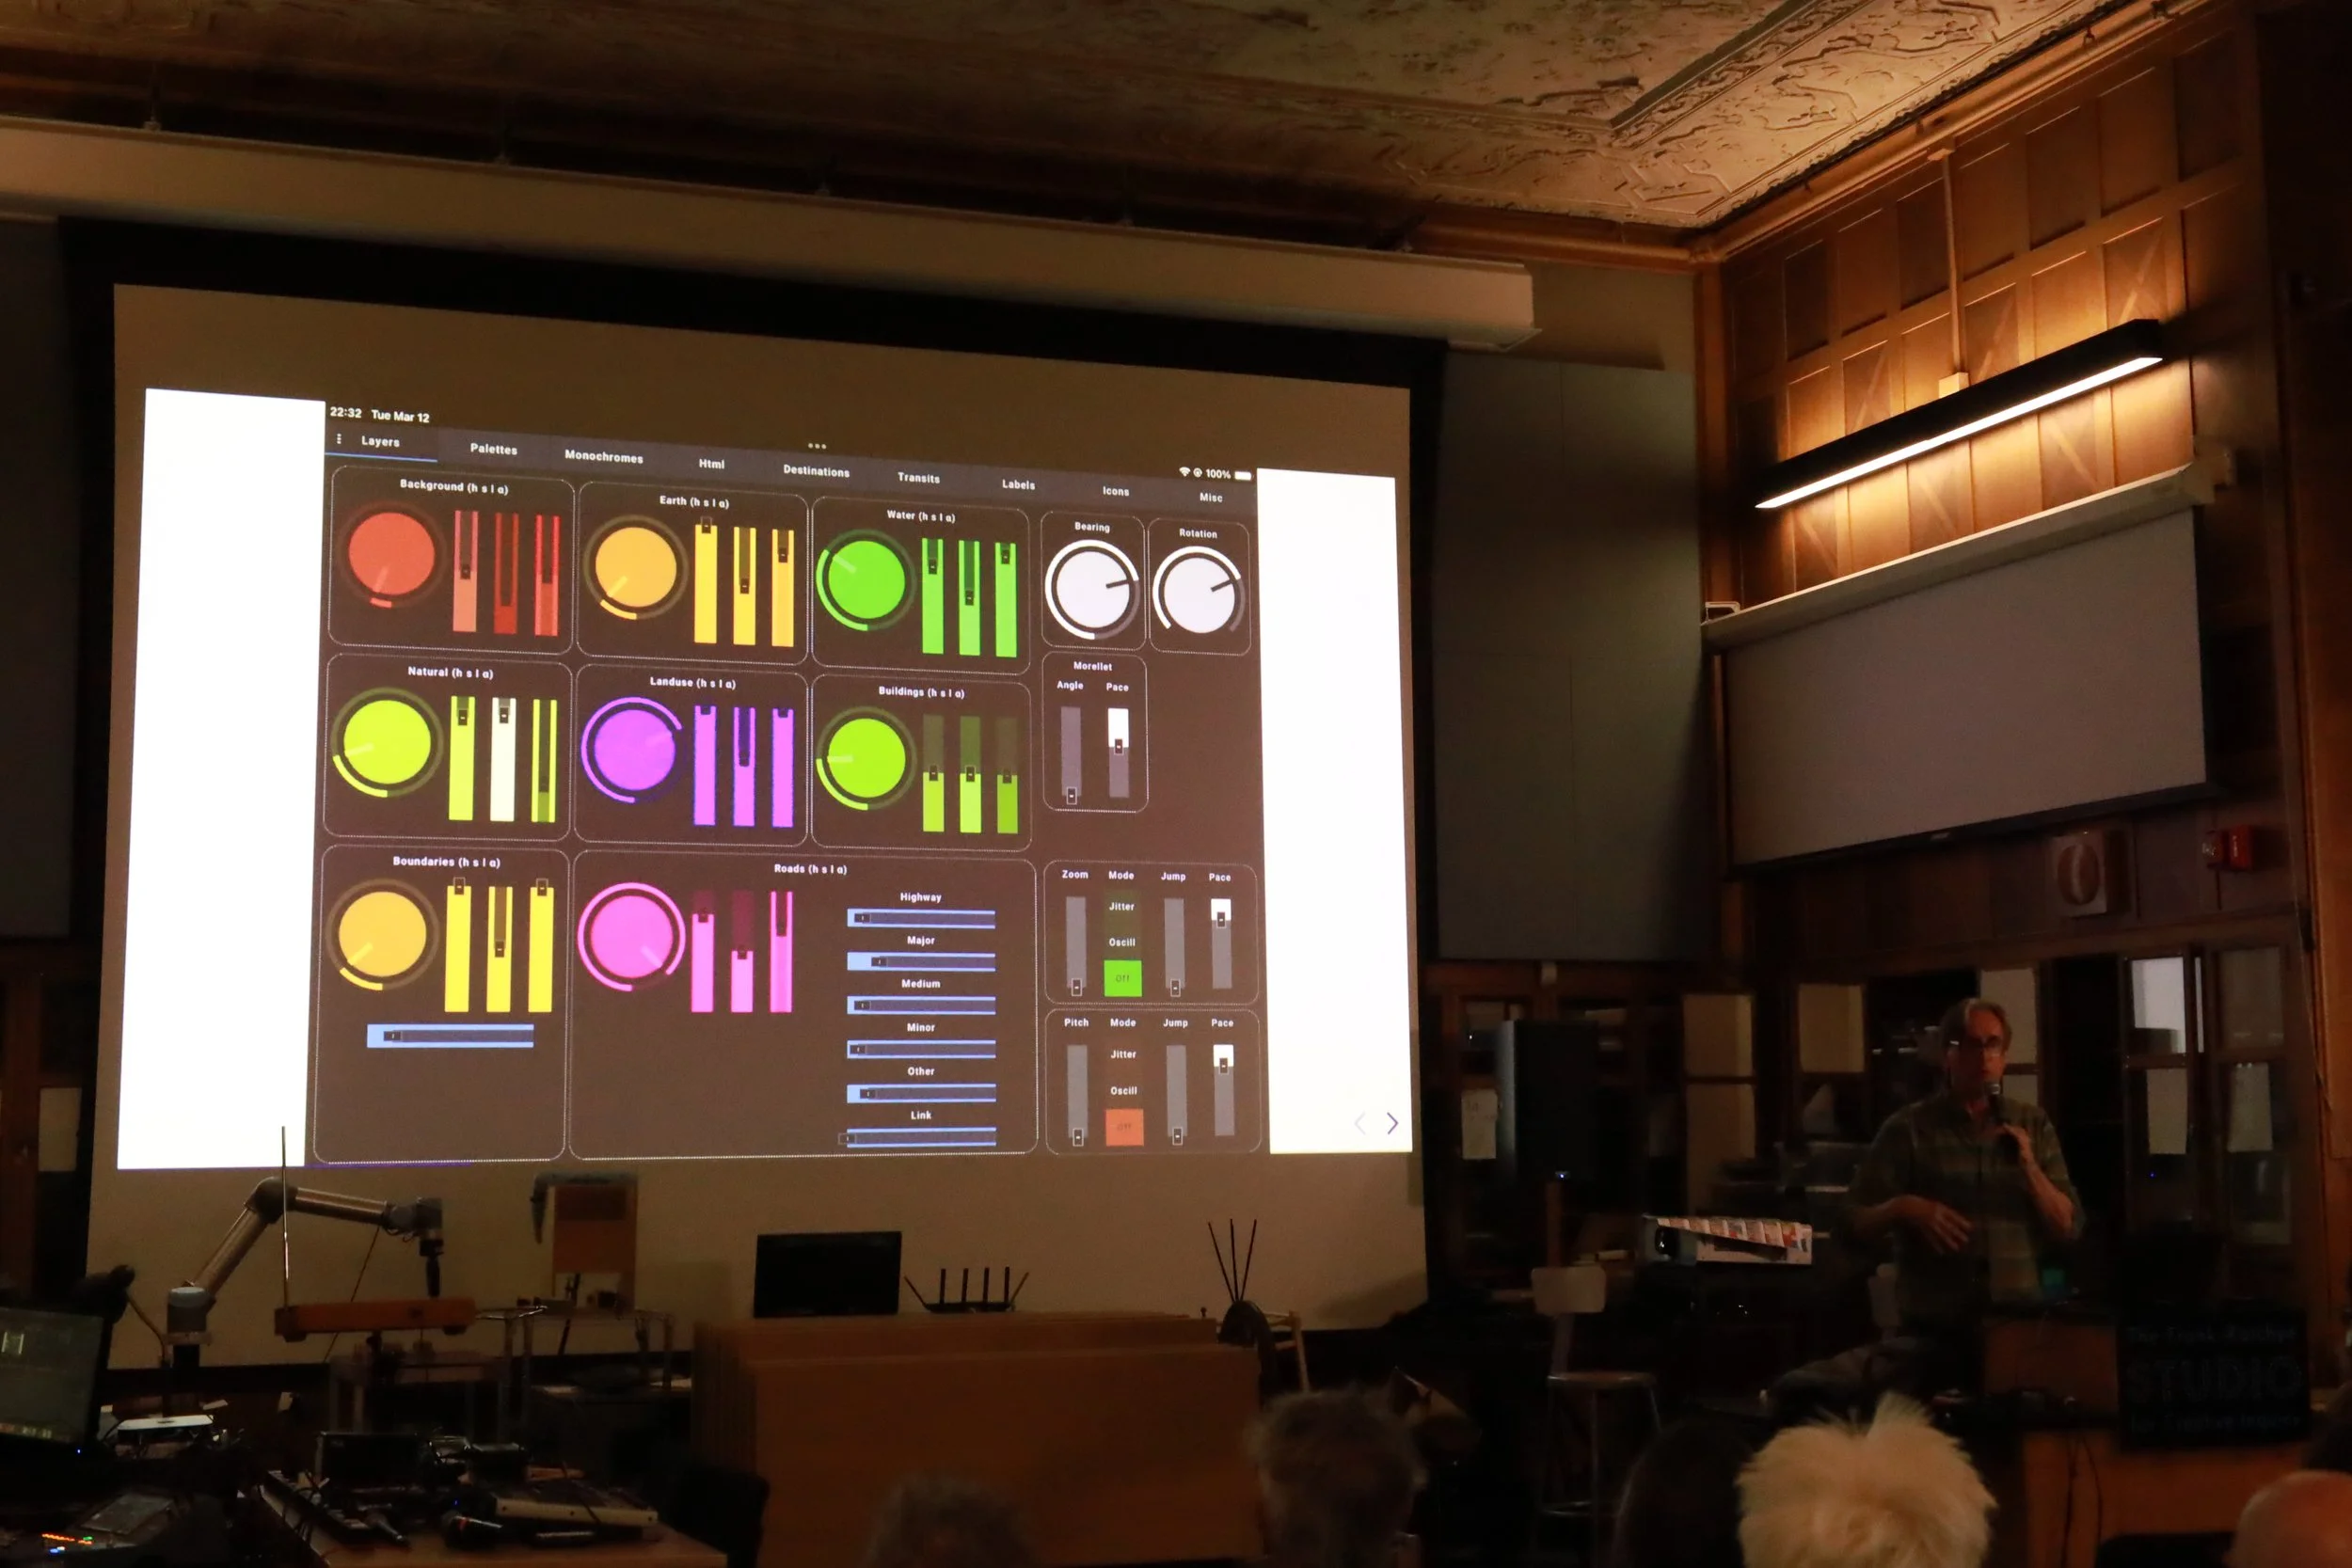
So this is all controlled with an iPad. The iPad uses what’s essentially a piece of music software called Open Stage Control, which is a framework for, you know, I need a knob here, I need a button here, I need a slider here, I need a graph here, I need a patch bay here.
So it’s really musical software that people use to control audio stuff. It’s flexible in what it sends. So my knobs send color information, it sends my hue, my saturation, lightness, and how much transparency there is for each of these geographical layers. There are buttons that fly to these different locations.
Because it’s in a web browser, I’m able to control things using cascading style sheet properties, so I can change borders and do things, make the map have kind of a lazén shape, which is unusual and surprising to people. Play controls for the GPS things I was talking about, or for routes—like, how do you drive from here to Santa Cruz and back, or something.
So that’s great, and that’s an amazing piece of software written by a French percussionist who, I don’t think, thinks of himself as a software engineer, but it’s remarkable software. And he’s quiet, you know, if you find a bug, it is fixed in three hours.
There's what's known as a tile server, the piece of software that actually delivers the data that contains which vector represents which road, and which polygon represents this building footprint. That’s called Martin, but it’s part of the MapLibre stuff that’s more technical than your listeners probably need to know.
Dr. Brett Crawford: Only takes one listener to really love it. And that's what it's there for.
Eric Theise: Yeah. Geek out listeners. So, and then what I've done, my unique contribution is writing software that takes. The inputs are sent from the iPad and turn it into instructions that make the map move or change colors or change fonts or change size or whatever.
Dr. Brett Crawford: You're DJing in some ways.
Eric Theise:I mean, yeah, I call myself a map jockey, at least in the early days, to get the idea across. I would say, I’m a map jockey. I take it a little bit more seriously now, but it’s still in some of the descriptions I sent out so people can visualize that. It was very hard at the beginning when I didn’t have documentation of these things.
Dr. Brett Crawford: And they're seeing an atlas probably in the background if they've ever seen such a thing.
Eric Theise: They're seeing the kind of historical maps that we both love, and see monsters maybe.
Dr. Brett Crawford: So I’m going to ask one more question, and then we have Hales here, who is our lead researcher at the AMT Lab, who might have a question for you. So I know that the Synesthete’s Atlas is one of your series. Do you have something else you are developing right now, or that you sometimes engage with?
Eric Theise: Yeah, it’s all based on the same software stack. But the Synesthete’s Atlas projects are always live and improvised. I do make videos that are just fixed. I collaborated with an international collective in Berkeley a couple months back called Plan, and we did an improvisation. So it was definitely in a Synesthete’s Atlas style, but they’re performing in Istanbul on Wednesday, and they asked me to contribute a video. And so I guess that’s an IF map, even though it’s being used in a performance context. Those things, you know, may end up in a film festival or a different context than the performance thing.
The one I’m proudest of: we have the tallest building in San Francisco, which is Salesforce Tower. There was this sort of unspoken rule for a long time that the Transamerica Pyramid is this very famous triangular kind of building, and you don’t build tallies in that. But all that went out the window in the past 15 years.
So there’s a very tall building now. And its saving grace is that the top eight floors are an LED display that was designed by Jim Campbell, whose work is resolutely low resolution. One of his things is like, what’s the minimum amount of information, numbered pixels or LEDs or whatever, that can still convey the fact that this is a person crossing the street, or these are people dancing, or these are waves at the oceanfront, or something.
So his work is up there every day when the sun goes down until midnight. But then there’s an artist-in-residency program basically, and one of my maps was up there for the month of February last year. It was a slow spiral from the footprint of the building out to basically encompass the Northern Bay area, spiraling out over the ocean, over Bolinas.
Dr. Brett Crawford: Oh, nice.
Eric Theise: But yeah, just a 10-minute loop that ran for an hour every night, and then one weekend—that was the only thing up there. And not only seeing it complete, you know, the weekend it was up, I went to every hill with my video camera and did documentation of that. But, you know, as you develop it, you meet with Jim and Emma, his studio manager, in a parking lot, like a mile from the building.
Dr. Brett Crawford: A mile away – that's how big the canvas is.
Eric Theise: But, but Jim sits in the back of his hatchback with a laptop, and he’s like, “Are you ready for the next one?” He does a few things, and this giant eight-story display, a mile and a half away, switches to whatever you gave him to preview.
Dr. Brett Crawford: Wow.
Eric Theise: It's crazy.
Dr. Brett Crawford: Crazy but fun. I can't wait for people to go through. I'm assuming some of those are on your website. Hales, do you have any questions?
Haley Wilson: I’m a visual artist. But I love any projects that involve this interdisciplinary aspect and especially the community. I really enjoy saying that when you come to a city, you find the venue, and then you find musicians or dancers, or just local artists here to work with.
At that moment, is there a period of rehearsal that you try to do, or is it always leaning towards improvisation? How is that planned out? And then, are there some moments that you try to make sure are totally hit in your performance, or is it all just what happens, happens?
Eric Theise: Those are great questions. Rehearsal is often the soundcheck where we set up, we do 20 minutes, and then the performance happens. So there’s really no time to develop anything. I mean, it’s exciting, and none of them have been bad. They’ve all been really pretty interesting.
Sometimes I have the luxury of generous artists. There’s very little money so it’s difficult to pay people for their time for rehearsal. But there’s a guitar-violin duo that I’ve worked with individually and together, and we did three rehearsals before our show.
It was definitely better for one thing: they got to understand what I was doing and the look of it in the field, and they were like, “Oh, it would be good if you could do this.” But if you’re actually in a room doing this, ideas come to people—it’s just much richer that way.
Talented, versatile is what I look for. And if they’re playing an instrument that I haven’t worked with before, that’s a bonus. I worked with this guy, Abe, in D.C. last year, who played the French horn. I’m not used to French horn being an improvising instrument, really. In jazz, and in Columbus a couple weeks ago, there was a guy playing cymbals. Which was beautiful and really quite rare and very pretty sounding. So that was, that was really fun.
Dr. Brett Crawford: And I think that’s true in other domains when you’re doing that sort of improv, whether you’re jazz musicians or improv artists in the theater. You don’t always get a lot of time. You know, the skills you’re bringing into the room and it is a luxury when you get to actually create relationships and have that time. For those interested, what is the best way to reach you?
Eric Theise: My website or Instagram. I’ve performed in Mexico this year and have done some stuff in Europe. You go to a different country, and everybody’s using WhatsApp, you know, and you go somewhere else, and they’re using something else. And six months later, I had this conversation before, like where is it? And if it’s not an email, I’ll never see it again. It really is a bummer.
Dr. Brett Crawford: It is. And that, as a historian, I’m always like, “Oh, the history we’re losing every second of the day.” Say that. So yeah, it’ll be interesting. I really appreciate your time, and I love what you’re doing.