

In 2021, at the tail end of a pandemic, we understand that our daily lives are somewhat inextricably entangled with the internet. Yet, an estimated 18 million households in the United States do not have access to home broadband. This is a statistic that arts managers should consider when planning online programming and in-person events as the world opens up. By looking closer at the digital divide and comparing counties’ internet access to their arts vibrancy, as measured by SMU DataArts, this article will look at the United States’ digital divide and how it impacts opportunities for arts participation.
The Digital Divide
The extent of the country’s dependence on the internet in the past year has not matched the level at which it is accessible to everyone. The Federal Communications Commission’s 2020 Broadband Deployment Report identified that while, as of 2018, 94.4% of the United States as a whole had fixed terrestrial broadband at speeds of 25/3 Mbps, only 77.7% of the population in rural areas and 72.3% of the population on tribal lands had that same access. This disparity caused by who has internet access and who does not is referred to as the “digital divide.” President Biden has made addressing it a priority by allocating $100 billion to broadband deployment throughout the rural United States in his proposed infrastructure package. The plan also promises to make broadband more affordable for low income individuals.
The Federal Communications Commission (FCC) uses broadband with a speed of 25/3 Mbps as its benchmark for “fixed advanced telecommunications capability,” and while this is a functional speed for streaming Netflix or YouTube and attending Zoom meetings, it is not necessarily fast by today’s standards. This article, however, will continue to use home broadband access at the speed defined by the FCC since that is the determining factor for internet access in the agency’s most recent data. While smartphones and 5G also offer options to connect, home broadband presumably allows access to things like live streamed performances and online art classes that wouldn’t be as functional on a smartphone .
In total, as of 2018, more than 18 million households in the United States did not have a broadband subscription. While data about broadband access from the FCC makes it look like the biggest issues are in rural America and on tribal lands, there are also problems with internet access in urban areas that are masked by the high concentration of people who do have internet access. A Brookings analysis of the Census Bureau’s American Community Survey (ACS) data found that the majority of “digitally disconnected households” actually live in metropolitan areas. Additionally, the gaps are particularly wide when looking at different neighborhoods in the same city. According to Brookings, “Even though urban cores and mature suburbs in the nation’s largest 100 metro areas have the highest median broadband adoption rates, they also experience the widest variation among their residents.”
Number of households without an in-home wireless or broadband subscription (in millions)
Figure 1: Chart of households without an in-home wireless or broadband subscription. Source: Brookings.
The level of disparity is also not consistent across different metropolitan areas. Brookings found that “In general, metropolitan areas with the highest overall broadband adoption rates also tend to have the smallest discrepancies between neighborhoods.” The analysis defined a census tract as being in digital poverty if both half of the households did not have a wireline subscription and half did not have a wireless subscription. While some areas performed well under this measure, researchers also identified that eight metropolitan areas, all located in the Southeast, have more than 20% of tracts in digital poverty. The only state to have two metropolitan areas included on this list is Texas. Additionally, both of those areas—McAllen-Edinburg-Mission, TX, (47.3% of tracts in digital poverty) and the El Paso, TX, metro area (30.1% of tracts in digital poverty)—lie on the country’s southern border with Mexico. My next article will take a closer look at this.

Figure 2: El Paso, TX, Metropolitan Area. Source: Brookings.

Figure 3: McAllen-Edinburg-Mission, TX, Metropolitan Area. Source: Brookings.
Racial Disparities in Internet Access

Figure 4: Chart of measures of digital access by race. Source: Pew Research Center.
In addition to location, there are also clear disparities in internet access along racial lines. According to a Pew Research study, while 79% of white Americans identified that they have home broadband, only 66% and 61%, respectively, of Black and Hispanic Americans reported having home broadband. Pew also inquired about device ownership, and while a good majority of white Americans (82%) reported having a desktop or laptop computer, only 58% and 57% of Black and Hispanic Americans said the same.
Because of this lack of access, almost a quarter (23% and 25%) of Black and Hispanic Americans are “smartphone only” internet users. While this provides some access, as anyone who has tried to do anything more than send an email or do a quick Google search can tell you, smartphones are not very effective for more than those activities. Things like online job portals and Zoom classes are largely inaccessible if you can only access the internet on a smartphone.
Hispanic Americans seem to fare the worst among the racial groups surveyed. Additionally, dividing this group into U.S.-born and foreign-born categories reveals that, while 87% of U.S.-born Hispanics own a smartphone, only 69% of Hispanics born abroad do, indicating that many Hispanic immigrants may not have any way to access the internet. This disparity also aligns with the data about metropolitan areas in digital poverty: both of the previously mentioned metropolitan areas with high levels of digital poverty in Texas—McAllen and El Paso—are on the border and have majority-Hispanic populations. The El Paso metro area is 83% Hispanic with a 22% foreign-born population (93% of whom are from Latin America). The McAllen-Edinburg-Mission metro area is 92% Hispanic with a 26.4% foreign born population (96% from Latin America).
Arts Vibrancy
Considering how the digital divide presents itself in the United States, what does that mean for arts access? Are peoples’ abilities to engage in arts experiences limited by access to the internet? Throughout the past thirteen months of the pandemic, one of the main—if not only—ways that people have been able to access arts events has been through the internet. Symphonies and theatre companies have streamed performances, museums have offered virtual gallery tours, and education programs have offered classes over Zoom. These are all things that people without home internet couldn’t access since computer use in public places like libraries was also limited by social distancing restrictions. Some digital artistic offerings—like artists’ Instagram Live performances—could be accessed from a smartphone, but more robust access requires a computer and home broadband.
Even without the pandemic, attending some arts events still requires some level of digital connectivity. Some common digital touchpoints include online ticket purchases, public transportation apps, parking apps for parking at the venue, and app-based program guides.
One way to measure the effect that widespread internet access (or the lack thereof) has on artistic opportunities is by looking at the arts vibrancy in each county, as defined by SMU DataArts. SMU DataArts defines arts vibrancy using a weighted score of arts providers, arts dollars, and government support at the county level. According to SMU DataArts, “Measuring community traits is more than a counting exercise. For example, we examine the per capita number of arts and cultural organizations. All else being equal, more arts and cultural organizations means more availability of arts experiences for people to engage with in that community, as well as greater variety for people to choose from.” Both arts vibrancy and broadband access are indicative of a connected, thriving community.
As displayed in the maps above, the level of broadband adoption isn’t universal across counties’ census tracts, so comparing county-level data is not foolproof. However, it provides a good place to start the comparison. To give an idea of what broadband access compared to arts vibrancy looks like in the United States, I looked to Texas because it has both four, very large metropolitan areas and large swaths of rural areas, which vary widely in the percent of people who have broadband access.
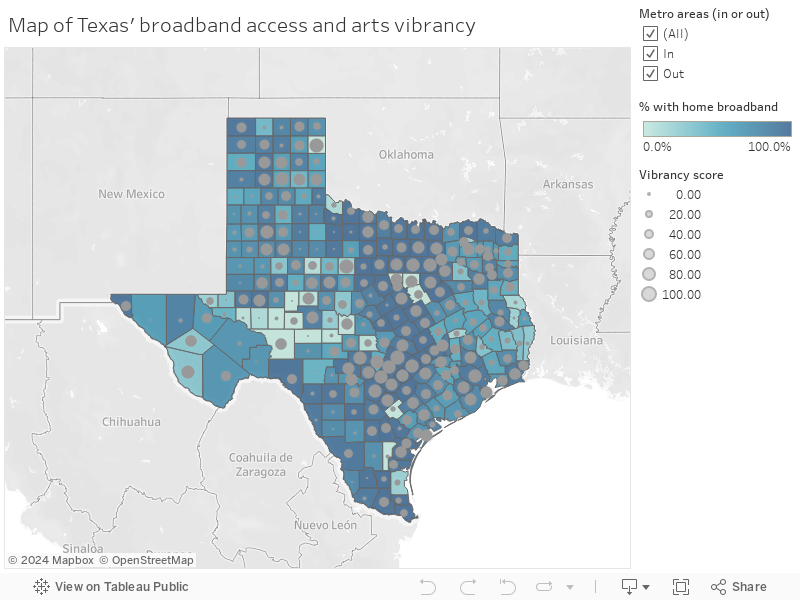
Figure 5: Map of home broadband access and arts vibrancy in Texas. Data sources: SMU DataArts Arts Vibrancy Map and FCC.
As the map shows, Texas has counties with every combination of arts vibrancy and broadband deployment levels. Metropolitan areas and the counties surrounding them are consistently darker blue (meaning that there is a high percentage of the population with home broadband). As mentioned previously about the data, however, county-level broadband data can mask disparities between census tracts, particularly in more urban areas. To view only the counties of Texas’ six largest metropolitan areas, select only “in” on the “Metro areas (in or out)” list.
Interestingly, out of the six metropolitan areas included, Hidalgo county (which includes the McAllen-Edinburg-Mission metropolitan area) and El Paso county have the lowest vibrancy scores by a wide margin—38.90 and 44.25, respectively, while the rest of the metropolitan areas’ counties have scores above 80. While the percentages with home broadband in Hidalgo and El Paso counties are around the same level as the other counties including metropolitan areas, as noted from the Brookings research, these two metropolitan areas have some of the largest disparities in internet access between census tracts.
Conclusion
The differences in arts vibrancy and broadband access in these counties on the border represent a microcosm of several of the factors that exacerbate the digital divide in the United States. In part two of this research, I will be looking at some of the specific ways that broadband access contributes to arts vibrancy—particularly focusing on the referenced counties on the Texas-Mexico border.
+ Resources
Federal Communications Commission. “2020 Broadband Deployment Report.” FCC, June 8, 2020. https://www.fcc.gov/reports-research/reports/broadband-progress-reports/2020-broadband-deployment-report.
Fishbane, Lara and Adie Tomer. “Neighborhood broadband data makes it clear: We need an agenda to fight digital poverty.” Brookings, February 6, 2020. https://www.brookings.edu/blog/the-avenue/2020/02/05/neighborhood-broadband-data-makes-it-clear-we-need-an-agenda-to-fight-digital-poverty/.
Perrin, Andrew. “Digital gap between rural and nonrural Americans persists.” Pew Research Center, May 31, 2019. https://www.pewresearch.org/fact-tank/2019/05/31/digital-gap-between-rural-and-nonrural-america-persists/.
Perrin, Andrew and Erica Turner. “Smartphones help blacks, Hispanics bridge some – but not all – digital gaps with whites.” Pew Research Center, August 20, 2019. https://www.pewresearch.org/fact-tank/2019/08/20/smartphones-help-blacks-hispanics-bridge-some-but-not-all-digital-gaps-with-whites/.
Reardon, Marguerite. “Biden promises broadband for all in $2 trillion infrastructure plan.” Cnet, March 31, 2021, https://www.cnet.com/news/biden-promises-broadband-for-all-in-2-trillion-infrastructure-plan/.
Rutten, Kris. “Participation, Art and Digital Culture.” Critical Arts 32, no. 3 (2018): 1-8. https://www.tandfonline.com/doi/abs/10.1080/02560046.2018.1493055.
Vogels, Emily A., Andrew Perrin, Lee Raine, and Monica Anderson. “53% of Americans Say the Internet Has Been Essential During the COVID-19 Outbreak.” Pew Research Center, April 30, 2020. https://www.pewresearch.org/internet/2020/04/30/53-of-americans-say-the-internet-has-been-essential-during-the-covid-19-outbreak/.
Voss, Zannie Giraud, Glenn Voss, and Rebecca Johnson. “Arts Vibrancy Index Report VI: Hotbeds of America’s Arts and Culture.” SMU DataArts, September 2020. https://culturaldata.org/media/2152/arts-vibrancy-index-report-vi_smu-dataarts_sept2020.pdf.