

User experience (UX) design is a misunderstood creature. For some, the term may feel foreign, evoking thoughts of large corporations, touch screens, and the latest tech products. The fact that UX is often used interchangeably with more technical terms, such as user interface (UI) design, only exacerbates the problem. Although UI and usability can be integral components of UX design, they are only subsets of a larger entity. UX design explains how organizations value and practice relationships with audiences. These relationships are defined by the single and accumulated experiences that occur through interacting with an object in a given context. Experiences are both subjective and ever-present.

Image Credit: Author
In cultural institutions, UX takes many forms. Every component of an institution, whether developed intentionally or unintentionally, has a certain design behind. These experiences range from box office and ticket buying process in a theater, wayfinding in a museum, to audio guides. They key to making these experiences successful is understanding audience psychographics, or the classification of people according to their attitudes, behaviors, aspirations, personal biases, or other psychological criteria. If an institution truly understands how audience members consciously and subconsciously interact in a given environment, they can better design their spaces and develop programming.
Understanding psychographic systems is arguably one of the biggest challenges cultural institutions face. Proper UX design implies proactivity, meaning the environment or program is developed in tandem with psychographic research of the target audience. However, this is often not the case. Due to limited resources, especially in smaller organizations, market segmentation and program design are often created in the absence of psychographic research. Additionally, post-program evaluation can either be scarce or non-existent altogether.
Observation Studies to Create Datasets for UX Insights
One method of psychographic analysis that can easily be employed is an observation study to create a data set. In technical terms, an observation study is a system of data collection that draws inferences where the independent variable is not under the control of the researcher. In an observation study, subject responses are not predetermined. This is different from survey analysis, where the researcher directs subject responses through prompts.
However, like survey analysis, observation studies require structure. Variables to be measured must be established beforehand to create a cohesive dataset. Below are two examples of observation studies within cultural contexts. Both studies selected subjects at random for observation.
Carnegie Museum of Natural History, Pittsburgh, PA
In summer 2018, the Carnegie Museum of Natural History (CMNH) sought to understand visitor relationships with their issues-based exhibition, We Are Nature: Living in the Anthropocene. The curatorial goal of the exhibit was to inspire visitors to live life more sustainably and feel empowered to make a difference in the Anthropocene’s negative effects.

Entrance to the We Are Nature exhibit at the Carnegie Museum of Natural History, 2017. Image Credit: Author
In order to understand the visitor journey, an observation study was employed to gain insight into how individual patrons interacted with items in the exhibit. Using a layout map of the exhibit, each exhibit item was coded according to two criteria: design principle and rank on an optimism/pessimism scale. Design principles included curiosity, (items that piqued a visitor’s interest), relevance, (items that asks visitors to position themselves in relation to the Anthropocene), transformative, (items that challenge visitor perceptions and evoke strong emotional responses), and participatory, (items that engage visitors in physical or dialogic interactivity). Each item received a primary and secondary designation. Along the optimism to pessimism scale, items were coded based on both physical presentation and label text receiving a single, numerical rank of 1-Pessimistic, 2-Somewhat Pessimistic, 3-Somewhat Optimistic, 4-Optimistic, or 5-Other/Neutral. Optimistic items tended to present solutions and offer stories with happy endings. Pessimistic items featured sad or stressful stories, and did not offer solutions.
Over the course of one month, visitors were observed traversing the exhibit. Variables recorded included door of entry and exit (there were three within the exhibit gallery), visitor journey, total time spent in the exhibit, and dwell time at individual exhibit items. Total time and dwell time were recorded using stopwatches and entry/exit point, as well as visitor journey were recorded by hand with pen and paper on a copy of the exhibit map.

Image Credit: Author
Approximately 150 visitors were observed in this study. Each visitor map was aggregated using Tableau to produce various heat maps of the most common entry/exit points, visitor journeys, and most visited exhibit items. The major findings from this study were as follows:
Most visitors do not traverse the exhibit as curatorially intended
The average visitor spends ≈10 minutes in the exhibit (seeing the entire exhibit and reading the majority of label text takes the average visitor ≈45 minutes)
Visitors spent the most time interacting with Participatory items, and visited Relevant items most frequently
From a UX perspective, this study proved that in exhibition design, curatorial goals and expectations do not always align with actual visitor experiences. Just because an institution invests resources in writing out extensive labels, does not mean the visitor will take the time to read them. It all depends on the type of experience an audience cohort desires to receive. In the case of We Are Nature, this study suggested the exhibit’s audience was more interested in engaging in participatory, interactive experiences to learn about the Anthropocene, rather than passively reading label text. These conclusions inherently describe behavior, information which could not be obtained from demographics or surveys alone.
Public Art + Internet of Things = Civic Engagement, Pittsburgh, PA
During AMT Lab’s 2018-2019 Research Project, Public Art + Internet of Things = Civic Engagement, a similar observation study was developed to gain insight into visitor behavior with public art pieces. Five public artworks in Pittsburgh’s Downtown cultural district were selected for study. This study accompanied an extensive online network physically attached to the five artworks through QR Codes and geofences, where visitors were invited to interact via smartphone.

Katz Plaza in Downtown Pittsburgh (one of the public artworks used for study), Image Source: Pittsburgh Cultural Trust
Since these artworks were situated in open spaces, physical maps needed to be created to define the observation space. Unlike the We Are Nature exhibit which had a gallery space to contain visitors, these public artworks had no clear boundaries of where potential engagement could begin and end. In We Are Nature, visitors experienced the exhibit environment intentionally, whereas in this study, subjects entering the defined vicinity was purely situational. For each public artwork, maps were drawn to delineate possible entry/exit points, the artwork’s specific location, and points where the researcher could stand to observe. An example of one of these maps with their accompanying observation sheets is below:
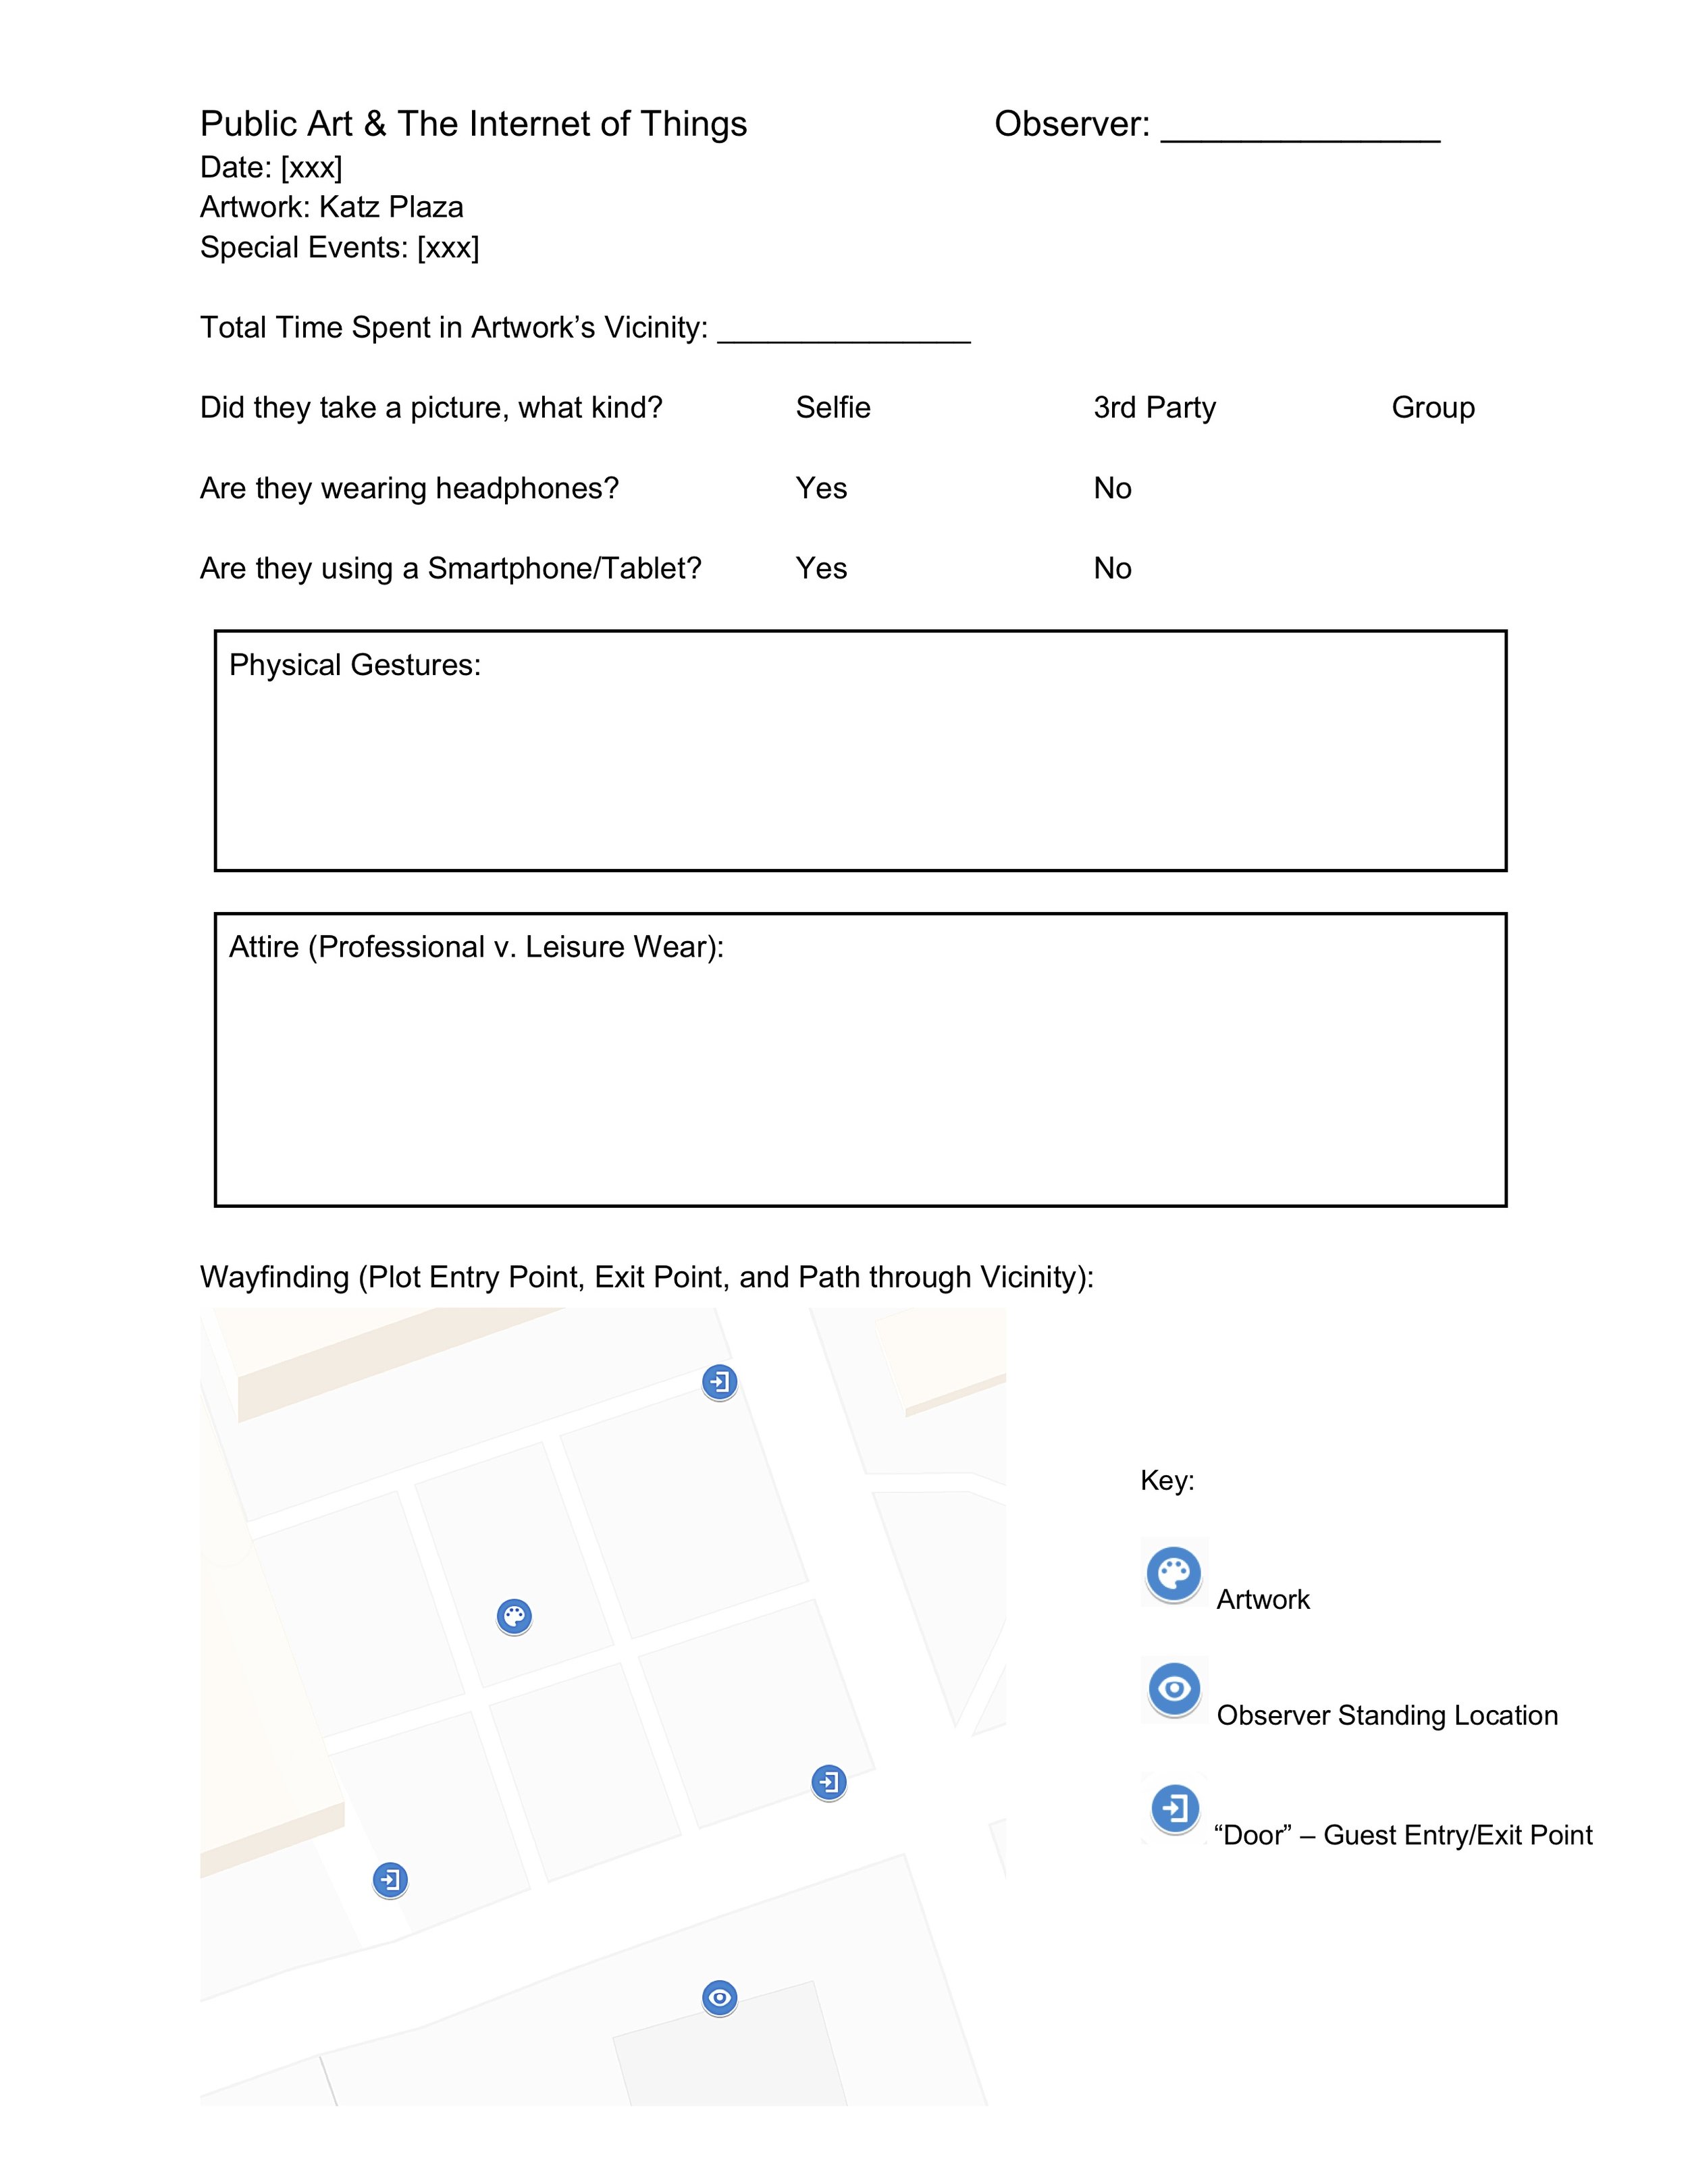

Like We Are Nature, variables for this study needed to be defined. For this project, variables included total time spent in the artwork’s vicinity, picture taking, whether the visitor was wearing headphones, whether the visitor was using a Smartphone or Tablet, any physical gestures (pointing, using phone, etc.), and attire (leisure wear v. professional wear). Preliminary findings from this study were:
People become conditioned to environments they interact with regularly; if a person passes a public artwork every day during their walk to work, over time it will no longer pique their interest
A significant portion of people moving about Downtown Pittsburgh focus their attention on their phone, which may affect their spatial awareness
In an urban environment, people may pass through an artwork’s vicinity multiple times because they are on an errand or going to a restaurant
Since this study was conducted over a two-week period, it is not comprehensive of the attention a public artwork may receive during its tenure. However, it does raise the general UX question, are people just too distracted?
Recommendations for Observation Study Development
There is no single way to develop an observation study. In the spirit of UX design, observation studies, just as experiences, are subjective and must be tailored to fit the specific environment, audience, and artifacts (for the purposes of the two studies above, the artifacts were exhibit items and artworks, respectively). Here are my best practices:
The Process Must be Fluid
In both case studies above, flexibility was imperative. Although it is important to set goals and variables in advance, there is truly no way to predict the way people will behave in an environment until you actually begin observing. For example, on the first day of observation in We Are Nature, I stood near the front door entrance to the exhibit waiting for subjects. I assumed since one of the gallery doors was labeled “entrance,” every visitor would pass through it, establishing a level of consistency. However, this assumption was quickly disproved when the majority of visitors entered through the other two doors of the gallery space, which were meant to be used as emergency exits.
In its first iteration, the We Are Nature study did not consider multiple points of entry into the gallery space. By the time the study was completed, this variable was one of the most significant findings.
Low-Tech Does Not Mean Low Quality
These studies were designed and implemented without the use of complicated hardware. For both studies, observations were recorded with a pencil and paper. In today’s world, we tend to be consumed by the latest data collection, surveying, and portable advancements on the market. My experiences with both of these studies revealed that sometimes the most meaningful connection between arts management and technology is something simple.
When observing subjects, researchers must be able to act and record information quickly under various environmental conditions, especially if the study takes place outdoors. In my experience, old-school pencil and paper is the most straightforward, cost-effective, and adaptable means to collect data. Additionally, if researchers need to be trained in observation, the focus can be on collecting the data itself, rather than learning how to use complex collection software, or how to deal with technical difficulties.
Be Aware of Implicit Bias
As human researchers, we are wired to operate under some form of implicit bias. Implicit bias refers to the attitudes or stereotypes that affect our unconscious understanding, actions, and decisions within an environment. In observation studies, our implicit bias tends to reveal itself when we take on the position of the researcher. Although we may be instructed to select subjects at random, the way in which our subconscious selects who we observe may not be as random as we intend. For example, if two potential subjects enter an observation space at the same time, a researcher may unintentionally choose to study the subject whose demographics are more similar to their own. If implicit bias is at work, these decisions are made without a researcher’s intention or control. This does not mean all observational data sets are skewed and unreliable. Implicit bias is merely something to be aware of and address in your analysis, as it can have some effect on an overall study.
Conclusion
Observation studies are an effective way to measure psychographics. In cultural institutions, such as museums, where experiences are self-directed, understanding how visitors behave and interact within a physical space is critical to developing successful programming in the long-term. Additionally, for a cultural institution where internal resources may be limited, observation studies are a financially sustainable method to collect meaningful data. Like the observation process, an institution’s functional and programmatic UX Design is fluid and is as important to longevity as mission. After all, the ways in which a cultural institution achieves its mission, is an experience in itself.