Fundraising is a critical component of almost every nonprofit arts enterprise. This spring, the Arts Management and Technology Lab recruited a group of contributors and graduate students to conduct a national benchmarking analysis and survey of arts organizations analyzing four emerging digital fundraising pathways: Text message / SMS giving, peer-to-peer portals, Facebook nonprofit tools, and mobile auction apps. The final report will be published in October. The following kicks off a 5 part series that highlights the findings. This article offers specific statistics on fundraising with subsequent pieces providing details on the individual pathways and a summary of the national survey's findings.
AMT Lab commissioned the study for two reasons. First, individual giving is a dominant mode of contributed income in the arts. A generational change is already beginning to affect the pathways through which individuals support their favorite causes. Second, while nonprofits more broadly are quickly adopting emerging fundraising tools, they are less common in the arts sector -- at least as appears evident from conference proceedings and general discourse in the field. To better understand the best practices in these emerging pathways and the opportunities and obstacles facing arts institutions in using one if not all of these tools, this study seemed urgent in light of the changing marketplace.
The following presents the data explaining why cultivating individual donors across multiple pathways and giving levels is essential to sustainability in the field. While your institution might vary from these national statistics, the aggregate numbers offer a good perspective on where you stand.
Fundraising Trends—All Nonprofit Organizations
According to the GivingUSA 2017 report, about $390.05 billion was contributed in the United States to all nonprofit organizations in 2016. The majority of total giving came from individuals at 72% which grew 3.9% from the year prior. While individual giving increased from 2015 to 2016 along with institutional support, institutional giving remained a smaller proportion of total giving. 15% of total giving in the United States in 2016 came from foundations increasing 3.5% from the year prior. Corporate giving was the smallest percentage of total giving in 2016 at 5%, but it increased 3.5% from 2015. The remaining 8% of total giving came from bequests. Also, the top three areas of giving in 2016 were to religious organizations at 32%, educational institutions at 15%, and human service organizations at 12%. Giving to arts, culture, and humanities fell to eighth place at 5% ($18.21 billion), with overall sector growth of 6.4% over the year prior.
What is important to note from this data is that individual giving is the driving force to philanthropic support. A similar lesson for both the arts and other nonprofit organizations is that their attention and contributed income efforts should be focused on individual support in order to stay financially viable. By looking that this evidence, nonprofit organizations, particularly the arts, should be investigating additional channels like digital fundraising pathways to increase support coming from individual giving.
According to an article by the Stanford Social Innovation Review, individual support is important no matter the size of the organization. In 2015, small-budgeted nonprofit organizations raised 36% of their annual income from individual giving alone. In addition, annual gifts from individuals averaged $435, while the average individual gift from online giving sources averaged $210. Though the latter online giving figure may appear small, many donations in a similar amount accumulate and are critical to the overall support of an organization. Digital fundraising pathways supplement an organization’s traditional fundraising practices and bring in an additional revenue stream. M+R Benchmarks of 2017 mentions that "Online (giving) revenue increased by 14% in 2016." GivingUSA 2017 data supports this trend as well, "Online giving has grown across the sector but remains underutilized in some sub-sectors[sic]." It seems the arts have the potential of going digital to supplement their individual giving streams. The following evidence is a snapshot of fundraising trends specific to each artistic discipline.
Fundraising Trends—Visual and Performing Arts
As noted in the GivingUSA report, giving to arts and culture organizations is rather minuscule when compared to the other sectors, but there is opportunity for more growth, particularly in individual giving. Contributed income for visual and performing arts organizations on aggregated range from 43 to 50 percent of total income. Arts organizations, dependent on discipline and year reported, depended on approximately 50 to 70 percent of their contributed income from individuals. Contributed and earned income levels for arts organizations are similar with slight differences dependent on artistic discipline. Dance and theatre organizations generate slightly more earned income, while orchestras, operas, and art museums depend more on contributed income. The following figures highlight contributed income trends in the following artistic disciplines: dance, music (orchestra), opera, theatre, and museums. Information is drawn from reports by Dance/USA, League of American Orchestras, OPERA America, Theatre Communications Group, and the Association of Art Museum Directors.
Dance
According to Dance/USA’s Snapshot of the Field 2016, total contributed revenue and support for dance organizations was approximately 44.8% . There was no specific data available of the dance industry’s contributed income proportions in individual, foundation, government, and corporate giving.
Total Revenue and Support in the Dance Industry in 2016.
Orchestra
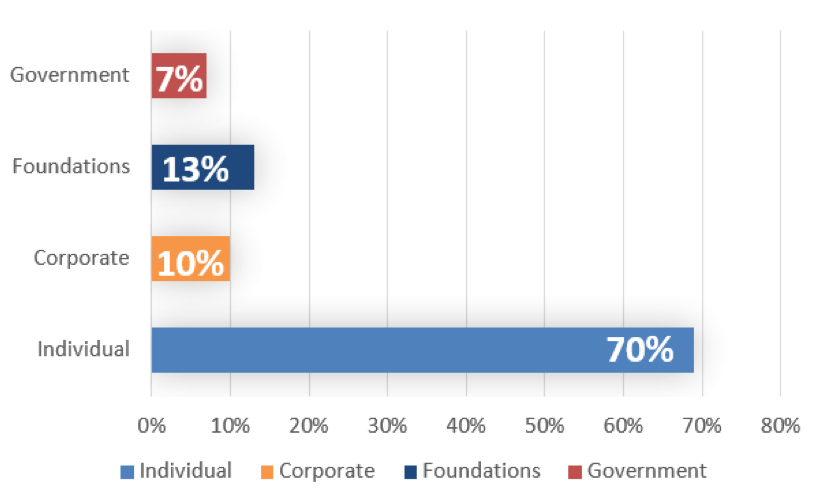
According to the League of American Orchestras’ Orchestra Facts 2006-2014 report, the contributed income of symphony orchestras was at 43%, and 70% of that income came from individuals.
Total Revenue and Support for the Orchestra Industry
Sources of Contributed Income for Orchestras
Opera
OPERA America’s Annual Field report for FY 2016 broke down its financial views by budget size. The following figure represents the contributed income proportions for opera organizations with a budget between $3 to $15 million for which approximately 50% of total revenue comes from contributed income with approximately 50% from individuals.
Percentages of Contributed Income in the Opera Industry
Theatre
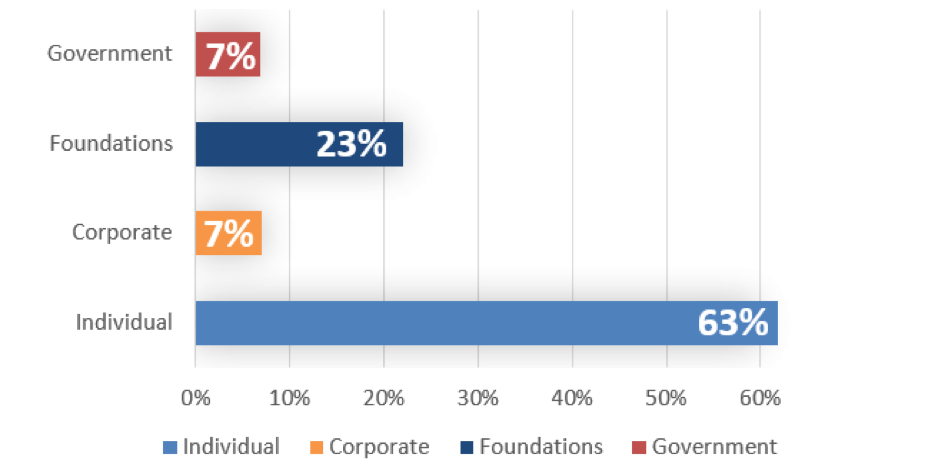
Theatre Communications Group’s Theatre Facts 2016 reported that about 48% of total income was contributed with 63% of all contributed income coming from individuals.
Sources of Contributed Income Theatre
Art Museums
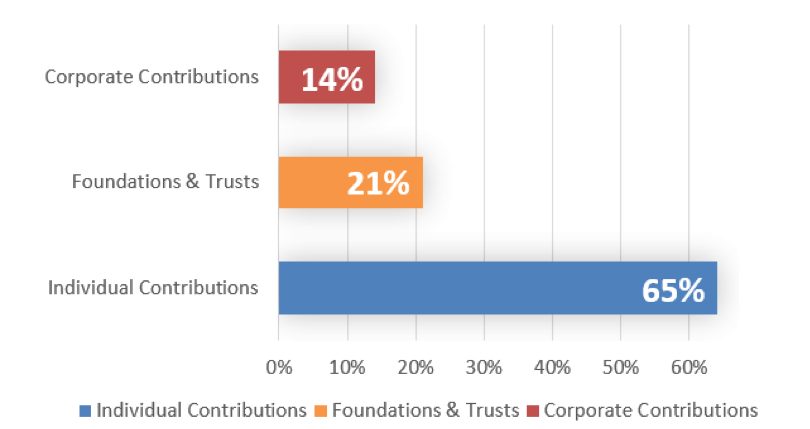
According to the Association of Art Museum Directors’ Art Museums by the Numbers 2016 report, 43% of total revenue was contributed with 65% of all contributed income coming from individuals.
Total Revenue and Support in the Art Museum Industry
Percentage of income by type for Art Museums
Sources of Contributed Income Art Museums
Hence, regardless of discipline, individual giving is the largest portion of support for the arts. An advantage that the arts have compared to other nonprofit sectors is that they have the opportunity of generating income from two channels: contributed and earned income. Depending on an individual organization’s revenue breakdown, this evidence suggests that the arts should be investing their resources into generating contributed income in a similar manner as they are for earned income. This is where digital fundraising technology much like digital communication tools can help to better support organization operations.
Click here to view Part II: Digital Fundraising with Text Messaging


