

Introduction: Why should arts organizations care?
The planet is experiencing the impacts of climate change, and global leaders are prioritizing critical action. In 2015, 196 countries signed the Paris Agreement, which committed to keeping global temperature rise well below 2 degrees celsius above pre-industrial levels (Paris Agreement). It further prioritized keeping temperature rise below 1.5 degrees celsius, the level at which scientists predict the most severe and irreversible impacts may be avoided. To remain below this critical threshold, greenhouse gas emissions must peak before 2025 and be reduced by 43% by 2030.
As we stand approximately at the half-way point of this goal, average temperature is estimated to have risen by up to 1.2 degrees celsius, and global initiatives to date have not been aggressive enough to track with goals for 2030 (IPCC). As of January 2024, the European Union’s Copernicus Climate Change Service found that the 12-month global temperature average reached a 1.52 celsius increase (2024).
International leaders have increased priority in reducing greenhouse gas emissions by implementing reporting structures across industries, including arts and culture. Arts and cultural organizations can have a unique role in addressing climate change, as they are critical in disseminating information, creating cognitive and effective engagement (Burke), and activating public participation (Rees). While these values can be demonstrated programmatically, it’s also important to incorporate them in operational practices. Though not often considered, arts and cultural organizations can generate significant greenhouse gas emissions. Facility energy use, transport and freight, and materials drive up institutional emission levels. Julie’s Bicycle, a U.K. based non-profit organization focused on climate action in arts and culture, has estimated that the visual arts sector is responsible for more than 70 million tons of CO2 emissions annually, primarily through facilities, art shipment, and visitor travel (The Art of Zero).
A variety of tools are available to start estimating an organization’s emissions. Read our comparative review, Tools for Tracking Emissions in the Arts, to learn more about industry specific resources.
Motivation for Measuring Environmental Impact
A number of arts organizations are taking action toward lowering emissions. As emissions tracking helps establish a clear understanding of current impact, it is often advised as one of the first steps in an organization’s emissions reduction strategy. But, what does this really mean? Determining what to measure, tracking down appropriate data, and analyzing results may take valuable staff time in oftentimes understaffed arts and cultural organizations. A study conducted in Nottingham found that lacking resources was one of the primary barriers for arts and cultural organizations to participate in climate work (Domingues).
Additionally, arts and cultural organizations may feel increasing pressure from funders, lawmakers, and other community stakeholders to track and report impact. Voluntary emissions reporting may strengthen public image, identify cost saving measures, and support opportunities for funding. Reporting may be required or necessary to meet policy standards. An organization may choose to contract an external firm to conduct an emissions audit, which is often the most comprehensive option. However, this may be cost prohibitive and still requires a certain degree of staff time and organizational record keeping.

Image created by author.
TYPES OF EMISSIONS
Emissions reporting measures an organization’s environmental impact as it translates to greenhouse gas emissions - which deplete the ozone layer and contribute to global temperature rise. The Greenhouse Gas Protocol Corporate Value Chain separates emissions into three categories:
Scope 1: Emissions that are owned by the company, including fuel for company-owned vehicles or on-site combustion.
Scope 2: Emissions that are generated offsite and purchased by an organization, such as electricity or steam.
Scope 3: Emissions associated with other aspects of the supply chain, including resources that the organization purchases, business or visitor travel, shipping, food, merchandise, costumes, etc. These are also called “Value Chain Emissions.”
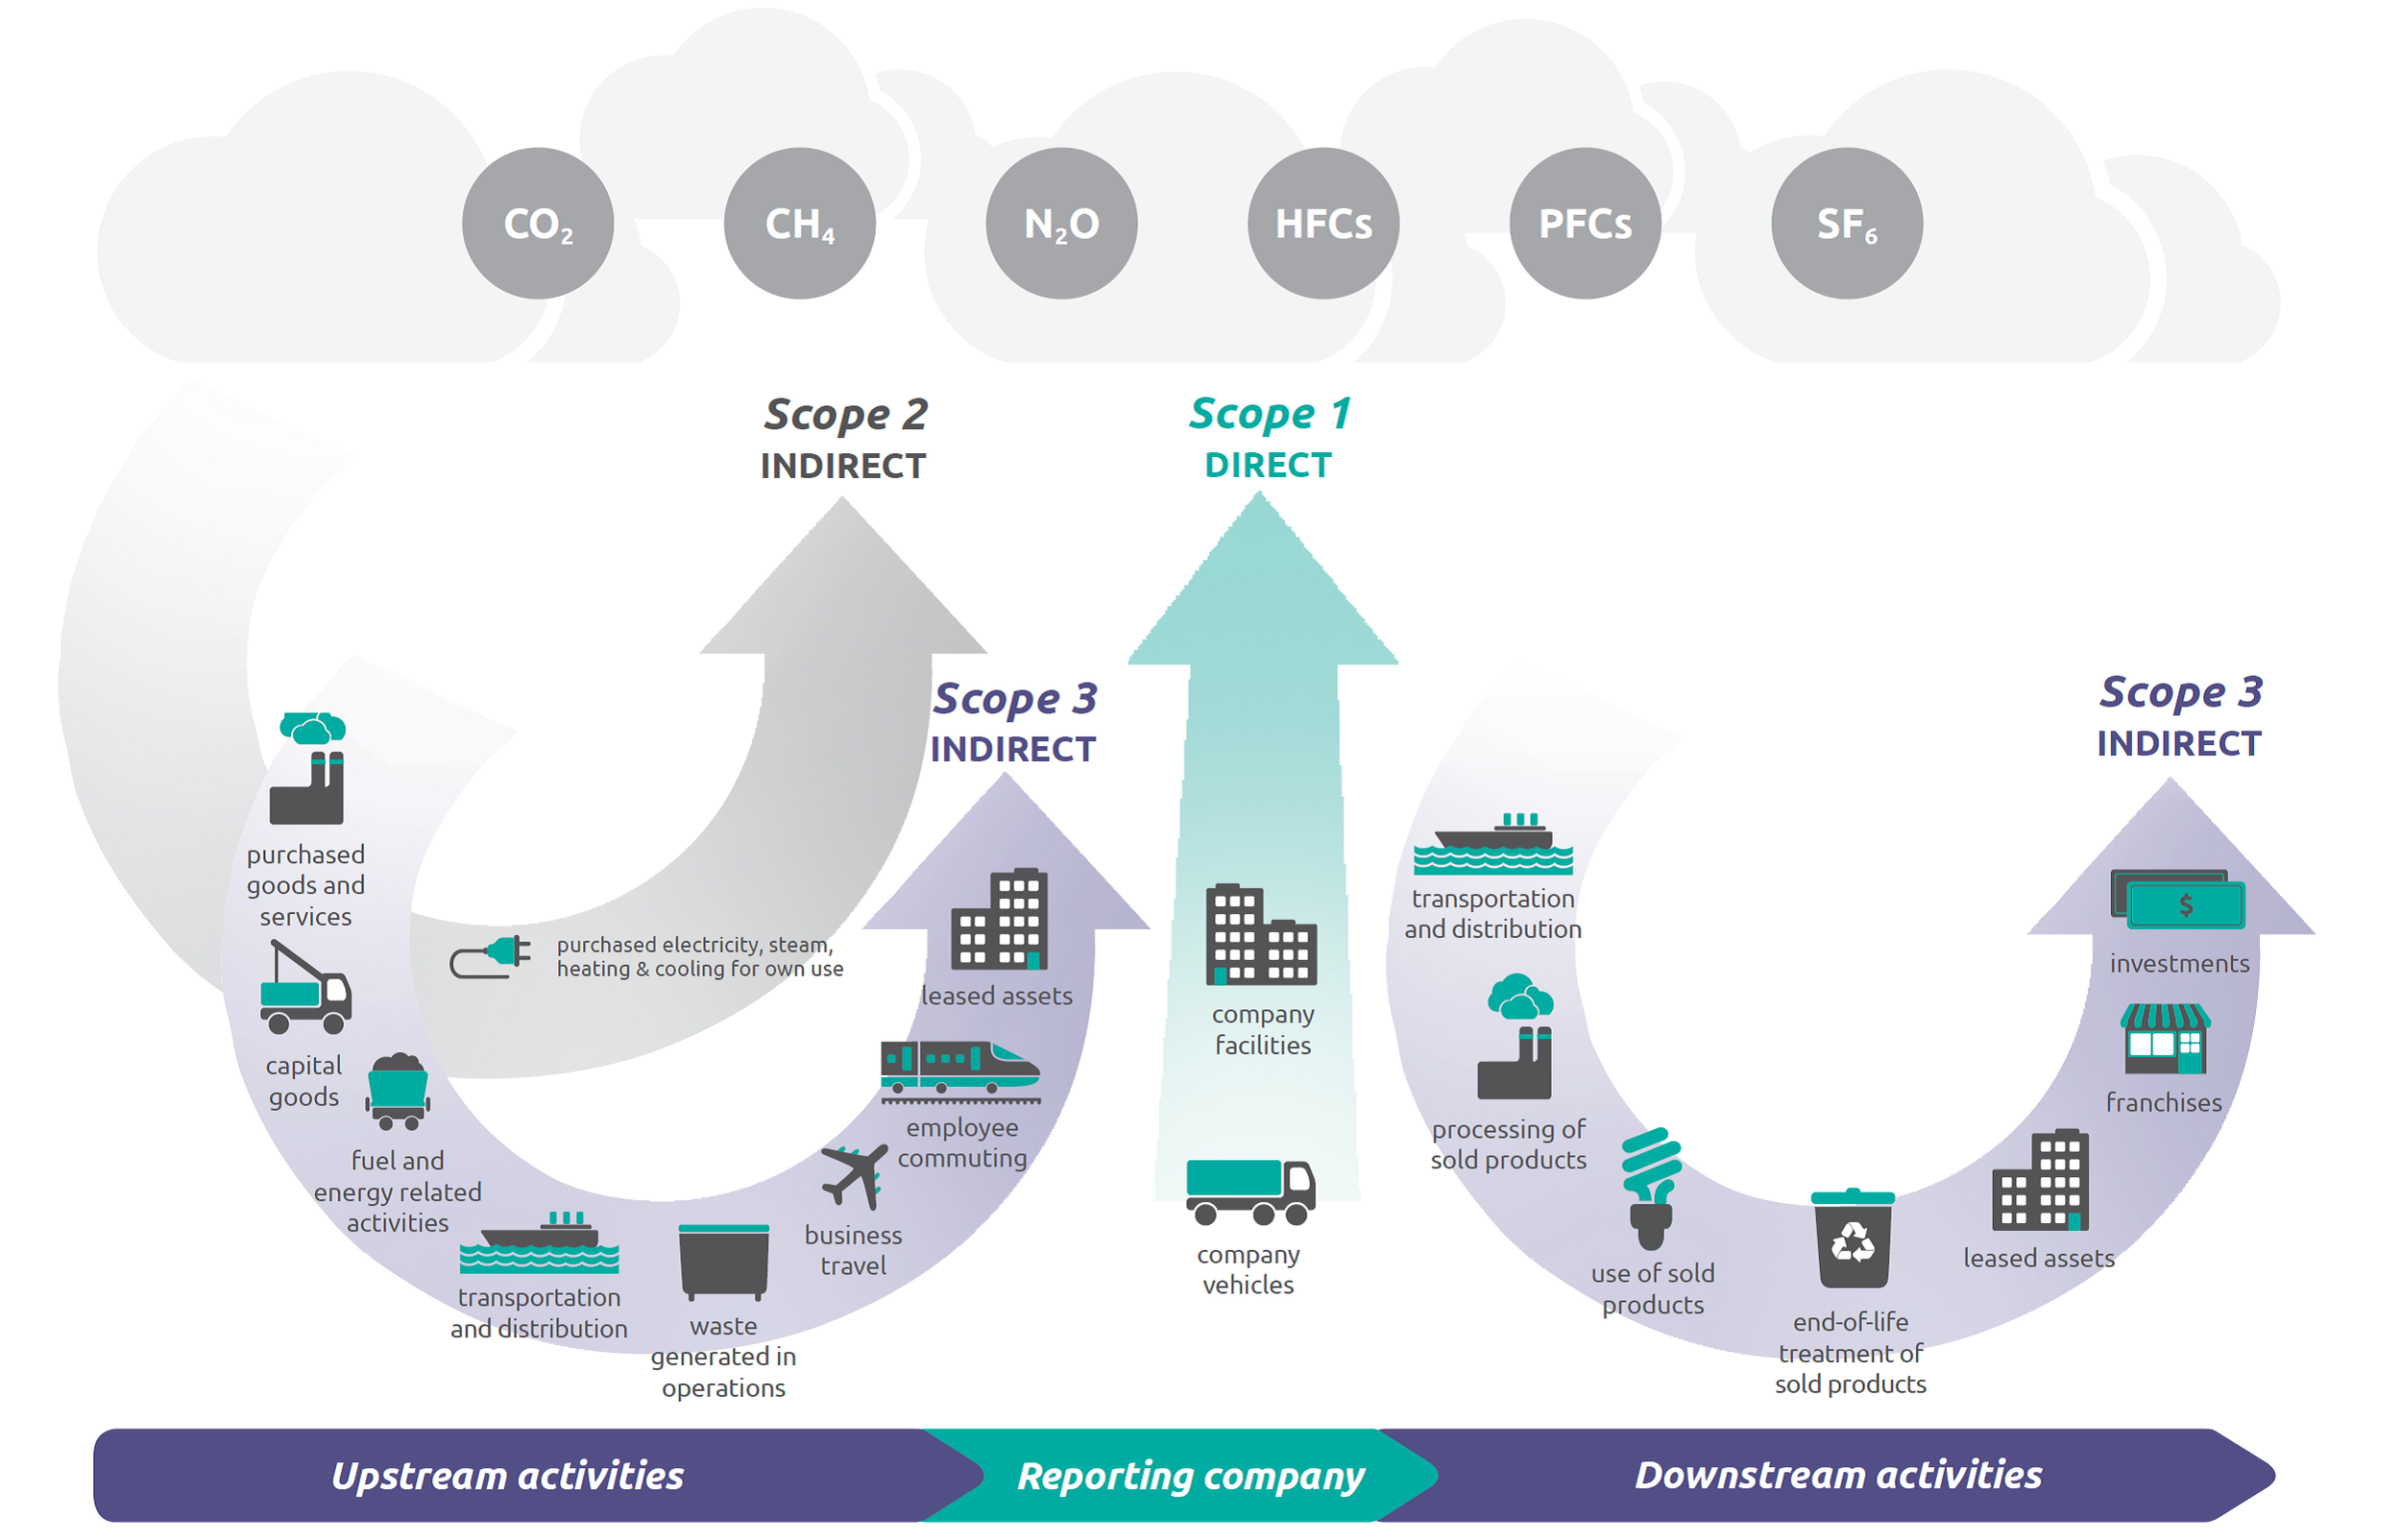
Source: WRI/WBCSD Corporate Value Chain (Scope 3) Accounting and Reporting Standard (PDF)
WHAT TO MEASURE
Currently, reporting structures focus on Scope 1 and 2 emissions, as Scope 3 emissions are more difficult to isolate and track. Scope 3 emissions can make up a substantial part of an arts organization’s overall impact, so an organization will likely need to prioritize those that are most impactful and measurable within their operations (GCC). An organization may choose to measure impact organization-wide or by venue, festival, exhibition, or other project.
Arts organizations are often unique from other institutions and facilities in their emissions patterns. Museums and galleries tend to be laid out with large, open rooms and high ceilings, making temperature control challenging and energy consuming. The unique lighting, temperature, and humidity levels required to preserve artwork and other cultural artifacts presents additional strain.
In the performing arts, again, the open design of the space comes with challenges to climate control. Lighting and audio systems often consume high levels of energy during performances. Set design, costumes, and props can create high levels of heavy waste, along with paper sheet music, programs, or scripts (Prado-Guerra). Touring performances or exhibitions come with heavy emissions from travel and shipment of materials. Across disciplines, audience travel is one of the largest sources of emissions associated with an arts organization, as the mission often relies on people being in a particular space to take part in an experience (“Practical Guide: Audience Travel”).
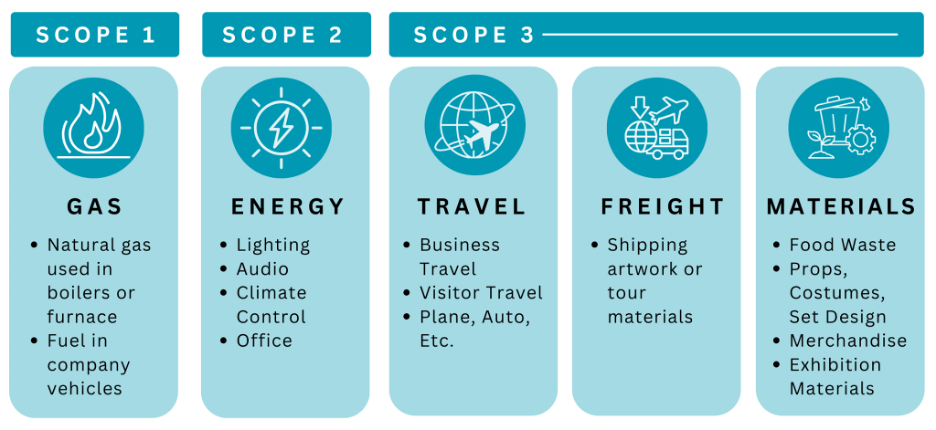
Common Emissions in Arts & Cultural Institutions. Image created by author.
HOW IT WORKS
Emissions accounting translates this business data, including spend and activity data, into emissions metrics (Normative 2023). Emissions are most commonly measured as CO2e, or “Carbon Dioxide equivalent,” a standardized unit of greenhouse gases such as methane (N2O), nitrous oxide (NH4), and fluorinated gasses. Some gasses are more potent, therefore CO2e is determined by multiplying emissions by the substance’s Global Warming Potential.
Definitions:
CO2e: “Carbon Dioxide Equivalent” is a measurement of greenhouse gas emissions, standardized to the global warming potential of CO2 .
Emission Factor (EF): How much of a greenhouse gas is emitted from a particular process, measured as the quantity of CO2, Methane, Nitrous Oxide, or other gas. The International Panel on Climate Change (IPCC) maintains the most comprehensive database of EFs which are widely used in carbon calculation tools. EFs can have a lot of variance, particularly by geographic region. For example, if an institution operates on an electric grid using totally renewable energy, it would change the associated level of emissions.
Global Warming Potential (GWP): A coefficient accounting a greenhouse gas’s effectiveness in ozone depletion - standardized to CO2 (the coefficient for CO2 is 1. GHG Protocol has established GWP values, which are most widely used for calculating emissions.
Equation: Calculating CO2e from Business Data
Adapted from The Carbon Accounting Company Report
CO2e = Activity Level x ( EFCO2 + EFN2O* GWPN2O + EFNH4*GWPNH4)
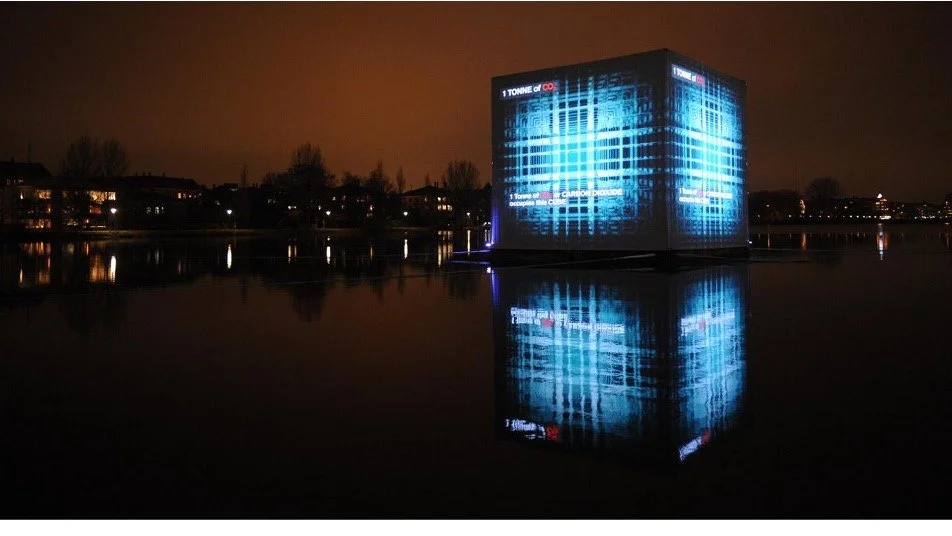
Image: One ton of CO2 emission would occupy the space of a 27ft3 - represented visually in by CO2 CUBE, an exhibition at COP15 in Copenhagen.
Image Source: TouchDesigner
COLLECTING DATA
Emissions reporting can be at an exhibition level or organization-wide. Before calculating emissions, an organization should prioritize what to measure and collect relevant business data. Some data, such as audience travel and material use, might not be readily available and could require establishing an internal data collection and record keeping systems to evaluate in the future.
Energy: Energy use data can be found on energy or gas bills. Typically, carbon calculators require the total kWh usage for each energy type. Some facilities also invest in power monitoring systems to get a more detailed usage data by room or type.
Business Travel: For flight, train, bus, or taxi transport - often, mileage and/or emissions data is included with purchase receipt.
Visitor Travel: The best way to collect this information is through a survey of visitors - asking where the visitor traveled from, what mode of transportation they used, if they carpooled, etc. ("Practical Guide: Audience Travel"). The overall impact of visitor travel can be estimated by applying survey percentages to overall attendance numbers.
Freight: Shipping information can typically be acquired directly from shipping companies, whether by air, sea, or ground transportation.
Materials: For the majority of materials (paper, cardboard, plastic, wood, cement, food waste, etc.), track the overall weight (or weight of one item multiplied by number of items). Additionally, keep track what happens at the end of its use - disposed, reused, recycled, composted. If calculating for a facility, waste measurements are likely available through your service provider.
Using this data on activity levels, emissions can be calculated manually or by using a carbon calculation tool. A variety of tools are tailored for museums, galleries, performing arts venues, festivals, and more, which automate emissions estimates. If an organization inputs activity levels of different practices, the calculator will apply EF and GWP to estimate the associated CO2e.
Reporting & Benchmarking
With a strong understanding of your organization’s impact, it is often beneficial to share findings - both with internal stakeholders and across organizations. Reporting typically includes final emissions data, and may be supplemented with activity level details, operational changes, plans for future emissions reduction, carbon offsetting details, or any initiatives outside of emissions which may contribute to an organizations sustainability goals.
Examples:
Pigfoot Theatre: Carbon Impact Report
Climate Action Database - Galleries Commit / Artists Commit: Exhibition Reports
Guggenheim Museum: Cecilia Vicuña: Spin Spin Triangulene Exhibition Carbon Emissions Calculation
Los Angeles Museum of Contemporary Art: Pipilotti Rist Exhibit
Benchmarking is defined as “the practice of comparing measured energy performance of a building to itself, similar buildings, or established norms,” according to the Culture Over Carbon report of museum emissions (Bowles 2023). Internally, this may help an organization gauge the success of their initiatives to their past levels, across facilities or programs. Externally, benchmarking may help supplement organizational knowledge and compare impact relative to similar organizations or exhibitions.
Conclusion
Arts organizations have a critical role in addressing global climate change, and many are already starting to take action. As institutions that inspire, educate, and activate the public, they have great potential to drive change, both within the industry and society at large. Approaching environmental sustainability is multi-faceted, and while emissions reporting may not tell the full story of environmental impact, it can be a critical entry point. Quantifying emissions can help an arts organization understand impact in a tangible and actionable way, supporting efforts to plan for change, identify cost saving initiatives, and enhance transparency with key stakeholders.
-
“Understanding Global Warming Potentials” United States Environmental Protection Agency. Accessed December 20, 2023. https://www.epa.gov/ghgemissions/understanding-global-warming-potentials
IPCC, 2018: Summary for Policymakers. In: Global Warming of 1.5°C. An IPCC Special Report on the impacts of global warming of 1.5°C above pre-industrial levels and related global greenhouse gas emission pathways, in the context of strengthening the global response to the threat of climate change, sustainable development, and efforts to eradicate poverty [Masson-Delmotte, V., P. Zhai, H.-O. Pörtner, D. Roberts, J. Skea, P.R. Shukla, A. Pirani, W. Moufouma-Okia, C. Péan, R. Pidcock, S. Connors, J.B.R. Matthews, Y. Chen, X. Zhou, M.I. Gomis, E. Lonnoy, T. Maycock, M. Tignor, and T. Waterfield (eds.)]. Cambridge University Press, Cambridge, UK and New York, NY, USA, pp. 3-24, doi:10.1017/9781009157940.001.
Rees, Morien. “Museums as Catalysts for Change.” Nature climate change 7, no. 3 (2017): 166–167.
Burke, Miriam, David Ockwell and Lorraine Whitmarsh. “Participatory arts and affective engagement with climate change: The missing link in achieving climate compatible behaviour change?” Global Environmental Change. March 2018. https://doi.org/10.1016/j.gloenvcha.2018.02.007
“Overview of Greenhouse Gases.” United States Environmental Protection Agency. Accessed December 20, 2023. https://www.epa.gov/ghgemissions/overview-greenhouse-gases#colorbox-hidden
“Calculator User Guide.” Gallery Climate Coalition. https://galleryclimatecoalition.org/usr/library/documents/main/calculator-user-guide-v2-aug-22.pdf
“Carbon accounting, explained” Normative. October 26, 2023. https://normative.io/insight/carbon-accounting-explained/
MOCA Sustainability Report 2022. January 31, 2023. Los Angeles Museum of Contemporary Art. https://www.moca.org/storage/app/media/Environmental-Council/MOCA%20Sustainability%20Report%202022_01.31.23.pdf
“Moving arts report: managing the impacts of our touring.” Volume 3, Theatre. Julie’s Bicycle. June 2010. https://juliesbicycle.com/wp-content/uploads/2022/01/MA_Vol3_Theatre_Report_2010.pdf
Bowles, Webly et al. “Culture Over Carbon: Understanding the Impact of Museum’s Energy Use.” September 2023. New Buildings Institute. https://ecprs.org/capacitybuilding/culture-over-carbon/
Domingues, Ana Rita, Muhammad Usman Mazhar and Richard Bull. “Environmental performance measurement in arts and cultural organisations: Exploring factors influencing organisational changes" January 15, 2023. Journal of Environmental Management. https://doi.org/10.1016/j.jenvman.2022.116731
“Scope 3 Inventory Guidance” United States Environmental Protection Agency. Accessed December 20, 2023. https://www.epa.gov/climateleadership/scope-3-inventory-guidance
“Scope 1 and Scope 2 Inventory Guidance” United States Environmental Protection Agency. Accessed December 20, 2023. https://www.epa.gov/climateleadership/scope-1-and-scope-2-inventory-guidance
“Venues and Theatres” Broadway Green Alliance. Accessed December 20, 2023. https://www.broadwaygreen.com/venues-theatres-1
“Cecilia Vicuña: Spin Spin Triangulene Exhibition Carbon Emissions Calculation” Solomon R. Guggenheim Museum. 2022. Report produced by Art to Acres. https://www.guggenheim.org/wp-content/uploads/2023/04/guggenheim-exhibition-carbon-study-cecilia-vicuna-spin-spin-triangulene-04.11.2023.pdf
“The Paris Agreement.” The United Nations Climate Change. Accessed December 9, 2023. https://unfccc.int/process-and-meetings/the-paris-agreement?gclid=CjwKCAiAvdCrBhBREiwAX6-6Uht7cXqGsOiAoCa9LNyU45k-B_QunhaBkURrItEz1kQF2o53UAJKcxoCl0oQAvD_BwE
“Decarbonisation Action Plan.” Gallery Climate Coalition. November 2021. https://galleryclimatecoalition.org/usr/library/documents/main/gcc_decarbonisation-action-plan_2021_final.pdf
Prado-Guerra, Alba, Sergio Paniagua Bermejo, Luis Fernando Calvo Prieto et al. “Environmental impact study of symphony orchestras and preparation of a classification guide.” International Journal of Environmental Studies. April 14, 2020. https://doi.org/10.1080/00207233.2020.1746546
“Practical Guide: Audience Travel.” Julie’s Bicycle. 2015. https://juliesbicycle.com/wp-content/uploads/2022/01/Audience_travel_guide_2015-1.pdf
“Sustainability” United Nations. Accessed December 10, 2023. https://www.un.org/en/academic-impact/sustainability
“The Art of Zero” Julie’s Bicycle. April 2021. https://juliesbicycle.com/wp-content/uploads/2022/01/ARTOFZEROv2.pdf
“Audience Travel Guide.” Julie’s Bicycle. 2015. https://juliesbicycle.com/wp-content/uploads/2022/01/Audience_travel_guide_2015-1.pdf
“GCC Data Gathering Template.” Gallery Climate Coalition. Accessed December 2https://docs.google.com/spreadsheets/d/18B6M02xVDeJNkh9m4f1uq5rqJDqVCU3KKAoM5qhvBj8/edit#gid=0
“Los Angeles Museum of Contemporary Art: Base Year Greenhouse Gas Emissions Report.” The Carbon Accounting Company. October 20, 2021. https://www.moca.org/storage/app/media/Sustainability-Report-2021/MOCA-Carbon-Inventory-2019.pdf
“Emission Factors Hub” U.S. Environmental Protection Agency. Accessed December 15, 2023. https://www.epa.gov/climateleadership/ghg-emission-factors-hub
“Warmest January on record, 12-month average over 1.5°C above preindustrial.” Copernicus Climate Change Service. February 9, 2024. https://climate.copernicus.eu/warmest-january-record-12-month-average-over-15degc-above-preindustrial