

Data, data all around. All this data, and what to do with it? Arts nonprofits around the country are working diligently to leverage attendance figures, donation reports, CRM systems, and social media analytics to make the most of their data. Reports are downloaded, numbers are crunched, and well-formatted excel sheets are made to identify trends and communicate organizational goals. When it comes to sharing this information with internal stakeholders, however, a picture really is worth 1,000 words (or in this case, numbers). Tableau is a business intelligence (BI) software that turns those facts and figures into accessible visual graphics, and is worth considering for your organization’s data-crunching needs.
Over the last year AMT Lab contributors have written about some excellent data visualization tools, and an article from 2015 highlights Tableau as a relatively intuitive drag and drop tool to explore and share data. Since 2015, Tableau has received some powerful upgrades that make the software even more appealing to arts nonprofits of all sizes.
The Best of Tableau
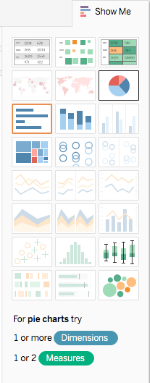
The number one reason to use Tableau (or another BI software) is because it allows you to quickly slice and dice data to identify things you may not easily notice in tabular form. After connecting to data, you can easily aggregate, rearrange, and stratify variables by dragging and dropping them into the appropriate fields. The data can be visualized in a number of ways, and when in doubt, Tableau’s Show Me feature makes visualization suggestions based on your data inputs. If you are a visual learner like me, manipulating the data visually will allow you to grasp insights you otherwise may have missed.
The Cost
In 2017, Tableau said goodbye to their $1,999/user/year price tag in favor of a more flexible subscription-based model. The Tableau Creator subscription costs $70/user/month (billed annually), and is likely to meet the needs of most arts nonprofits. The subscription comes with some important upgrade features such as access to Tableau Desktop and Tableau Online, which provide easy avenues for sharing visualizations with organizational stakeholders — for example, embedding an annual fund dashboard into a website or board portal, or monitoring ticket sales across departments.
$70 per user per month is still too high a price tag for some nonprofits. In anticipation of this, Tableau Foundation began offering free licenses to nonprofits in 2015. Most small to mid-sized arts nonprofits with an operating budget of less than $5 million are eligible to apply. Tableau also offers a 14-day freemium if you want to try before you buy — though be prepared to put in some training hours to really reap the benefits of the software.
Onboarding for Nonprofits
Since the launch of Tableau Foundation’s donated license program, Tableau has implemented training resources specific to nonprofit needs. They provide brief case examples of nonprofits that use Tableau, offer on-demand webinars for nonprofits, and provide sample dashboards made by real-world nonprofit decision-makers. (Dashboard is Tableau-speak for a single-screen compilation of important and interrelated visualizations.) Last but not least, they have a task force comprised of volunteer Tableau employees dedicated to working with nonprofits and helping them understand their data. They are called the Tableau Service Corps, and any nonprofit using Tableau can contact them for an appointment.
Getting Started
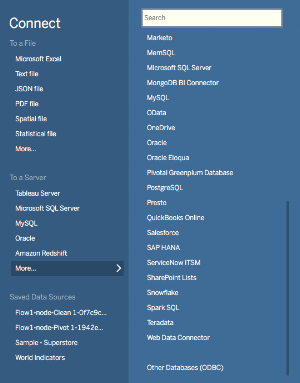
One of Tableau’s most convenient features is its ability to connect to a plethora of data sources, including Google Sheets, Quickbooks, and Salesforce. Tableau can host live connections to data sources, so you can add to or edit your data source and see the fruits of your labor immediately reflected in Tableau visualizations.
Tableau’s drag and drop interface is fairly intuitive, but users looking to make the most of the software should be prepared to devote some hours to training. Luckily Tableau offers extensive training packages and starter kits, complete with datasets to practice with. For a very basic competency in Tableau expect to spend 3 hours on training videos and practicing. 20 hours of training will lead to a comprehensive understanding of Tableau’s essential tools and capabilities. The essential functions of Tableau are more than enough to meet most analytical needs -- no analytics degree required (though Tableau has plenty to offer analytics experts as well).
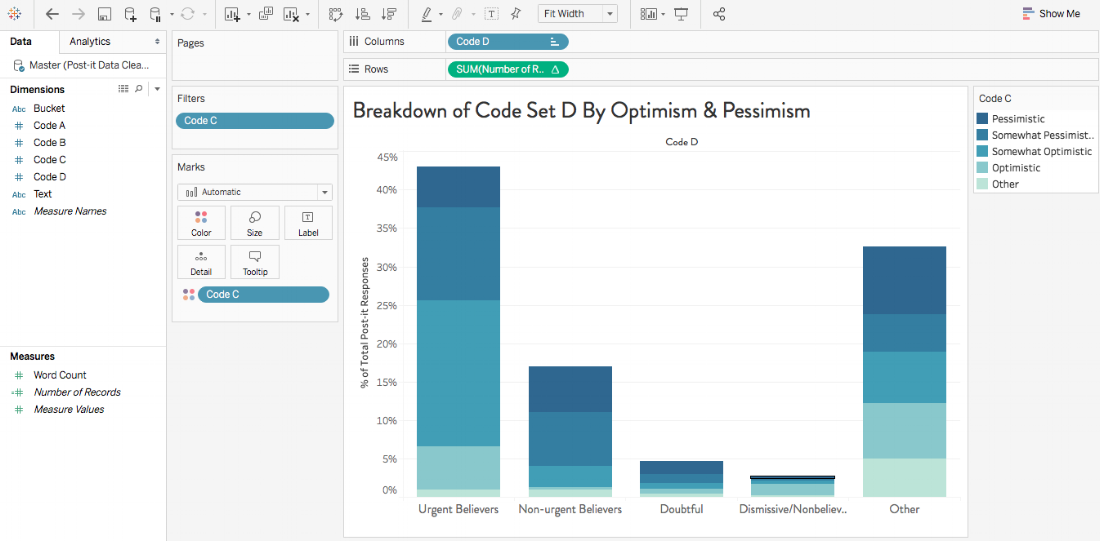
With relatively little training I was able to connect to an excel sheet, and create some basic visualizations that cross-analyzed two variables (one variable represented by column, and the other by color).
With a little more practice I was able to import a map and aggregate frequency data to visualize visitor behavior in a museum exhibit.

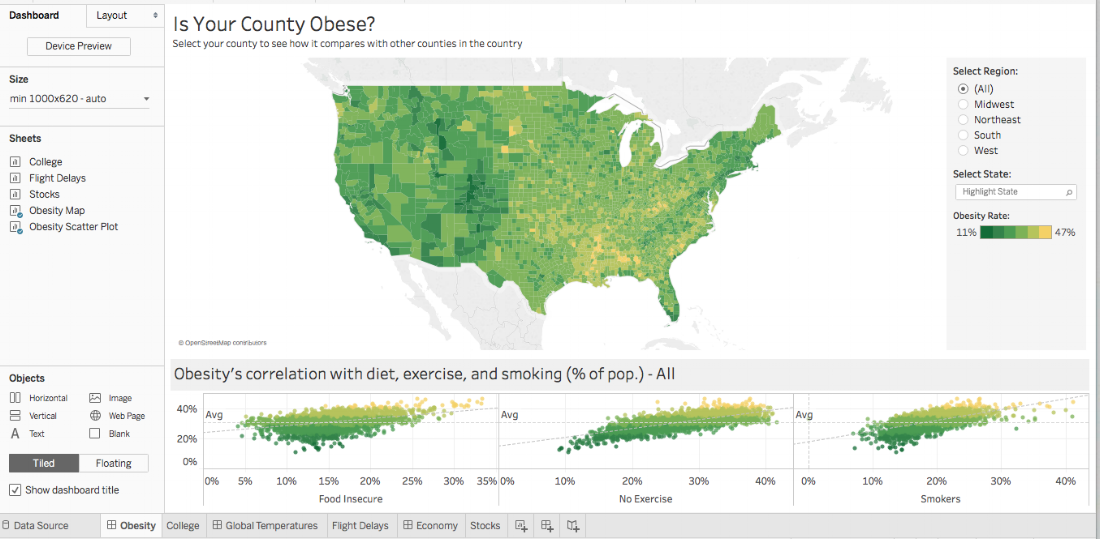
And those really well-versed in Tableau can create complex visualizations like the sample featured below. Tableau’s capacity to easily aggregate and visualize geographical data is useful for audience, donor, and marketing analyses.
Sharing
Embedding a really cool interactive map or dashboard in a website is easy using Tableau Desktop and Tableau Online. But sometimes you need the low-tech -- say, inserting a .jpg of a bar chart into a paper report or one-sheeter. Though this is easy to do in Tableau, the resolution of exported .jpg’s or .pdf’s is low. Additionally, there is no option to increase dpi. That being said, the resolution is good enough for most needs. If you’re looking for something really high res, be prepared to work some Photoshop magic on the exported visualizations.
The Bottom Line
Overall, Tableau is a great software to consider for arts nonprofits of all sizes. It is intuitive for the data-savvy user, and doesn’t require an IT department to upkeep or manage. The price point is relatively low and Tableau Foundation offers a means of subsidizing license fees. If your organization is interested in leveraging their data -- and easily communicating that data to stakeholders, then Tableau is one BI software worth considering.