
The reach of federal dollars into the communities of Pennsylvania is immense. Even a relatively small federal program like the National Endowment for the Arts has enormous local impact in communities across the state. At a time when the very existence of the NEA is under threat, data can arm arts managers with the tools to make the case that federal funding for the arts is impactful.
AMT Lab has explored this area before. Justin Gilmore's recent post Interactive Map: Who Received NEA Grants In 2016? maps a year's worth of NEA grants, giving the user a chance to select a location and learn who has received a grant, for how much, and for what project. Access to this kind of data can help people understand how close these federal expenditures are to their community.
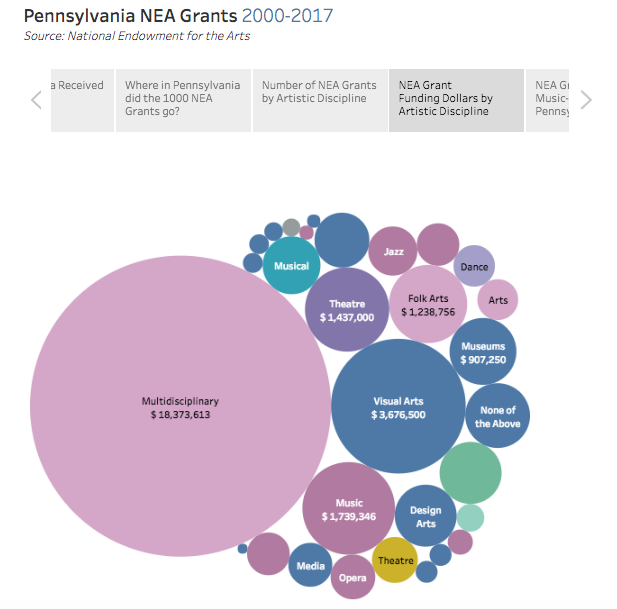
In this post, we explore this data at the state level, exploring how NEA grants have impacted Pennsylvania in the period 2000-2017. Using Tableau software, we have created a total of 8 charts that break down NEA grants in a variety of ways. You can scroll through the different charts by using the arrows below in grey. You can interact with the charts by hovering over certain areas with your mouse to reveal more information. In addition, some of them allow you to sort the data (there is an icon located at the bottom of the chart if it's sortable).

This brief glimpse at federal spending on arts and culture in Pennsylvania is made possible by the National Endowment for the Arts.