

After identifying which metrics and dimensions a manager will measure, the next step is the task of monitoring and reporting. To make this job easier, Google Analytics provides dashboards. A dashboard is a collection of ‘widgets,’ or data interfaces such as timelines or charts, that visually represent data. Dashboards help users efficiently review important metrics and dimensions, like traffic sources or social media shares, quickly generate reporting tools, and create data-friendly cultures through easy sharing and visually storytelling. Dashboards aid managers in processing website information and communicating that information to a broader audience.
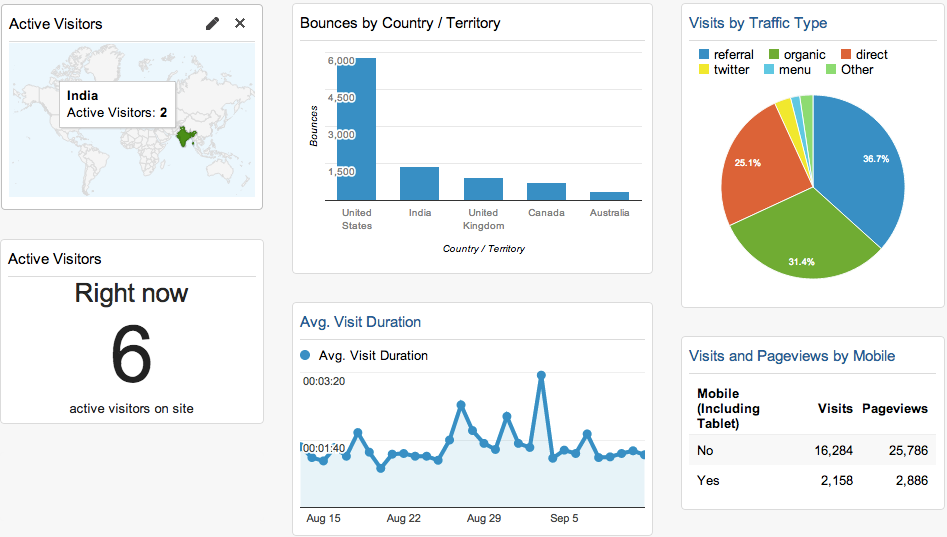
Examples of Google Analytics widgets by Kissmetrics.
Efficiently review important information
Understanding the activity surrounding even a single goal in Google Analytics may require looking at multiple variables. Many managers are under time constraints, making the task of repeatedly retrieving the same collection of metrics from individual report pages burdensome. Also, if a manager does not chronicle and standardize reporting methods (timeline observed, steps taken to arrive at desired data, etc.) there is a possibility of inaccurately reporting results. Google Analytics’ dashboard functions cut through those issues by isolating and automating collection of the desired information, centralizing it in one easy to access location.
Quickly generate reporting tools
Creating a dashboard gives users the ability to refresh, print, save, and share the most relevant metrics effortlessly. Depending on the reporting requirements for the organization, a manager could use the dashboard’s maps, charts, and graphs as a standalone report, or as a visual supplement to a fuller explanation. However, managers should be cautious when issuing dashboard reports to those unfamiliar with web analytics and with the dashboard’s components and purpose. A dashboard in isolation does not provide explanations of its contents, so any user without previous exposure to the dashboard will not be able to fully comprehend its significance.
Create a data-friendly culture
If an organization is struggling to incorporate data into its everyday operations, dashboards could be a useful starting point. Google Analytics allows users to easily share dashboards through shared access links and email, as well as print outs. (Note: in order to share links of dashboards the other users need to have access to the organization’s Google Analytics account.) Dashboards also encourage data consumption because they present data using visual aids, like charts and graphs. These visual aids are not only eye-catching but they give the user the ability tell a data-driven story in a new way. Finally, dashboards cater to varying skill levels of data analyses. Someone who knows little about the intricacies of data analysis can ask clarifying questions about the widgets, providing a point of entry to the world of data-informed decisions.

Social media dashboard screen shot provided by Dashboardjunkie.
Google provides a straightforward step-by-step guide to creating a new dashboard. That being said, creating a dashboard is far easier if the user already knows which particular data points will be monitored and, if audience segments are of interest, the audience segments are already created within Google Analytics. Current drawbacks to dashboards include limited customization of colors, fonts, and sizes of widgets and the cap of 12 widgets per dashboard.
Looking for dashboard ideas? Kissmetrics links to a host of collections including:
- Moz’s “5 Insightful Google Analytics Dashboards” - offers examples of a traffic overview dashboard and a visitor behavior dashboard.
- Dashboard Junkie – select the ‘Browse Dashboards’ dropdown menu to select a dashboard to explore. From the blog dashboard to the social media dashboard, each dashboard is thoroughly dissected to explain the widgets included, what each widget means, and which questions the dashboard answers. These dashboards can also be downloaded and imported free of charge to personal Google Analytics accounts.
- Econsultancy’s “10 Useful Google Analytics Custom Dashboards” – a collection of dashboards including an SEO dashboard and a content marketing dashboard from some of the web’s leading web analytics experts.
Want to learn more about optimizing Google Analytics? Click here to explore transferring and implementing organizational goals.