

Thank you to the nearly 900 respondents who participated in the 2015 National Ticketing Satisfaction Survey. The survey analysis team has been busy working on analyzing the responses and we wanted to share a sneak preview of our insights so far.
What types of organizations answered the survey?
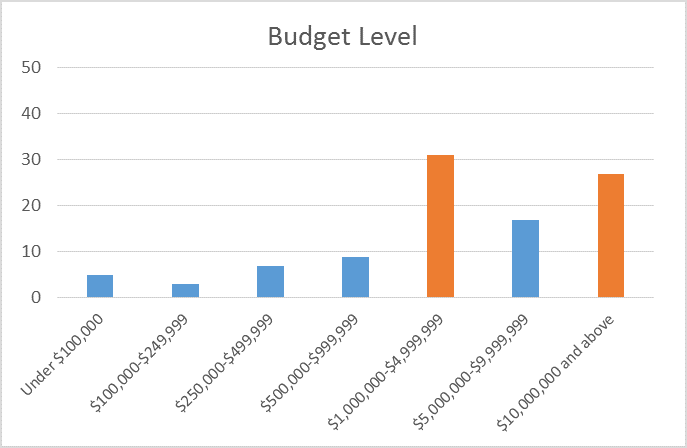
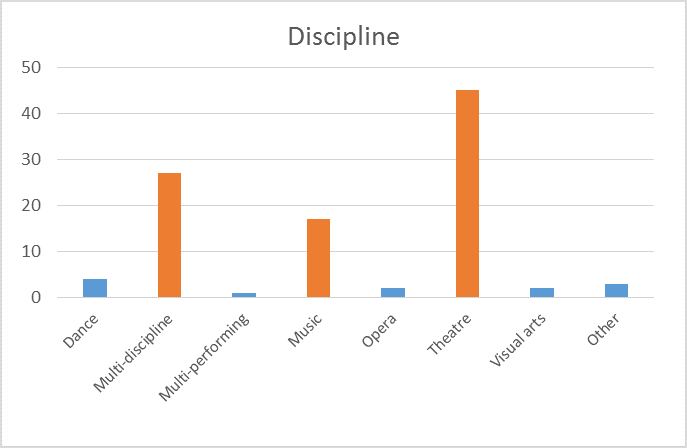
Respondents who answered the survey represent a wide variety of organizations, allowing for deeper analysis among segmented groups. As seen below, organizations fall within a range of budget levels and disciplines in regions distributed across the U.S., though they are mostly performing arts focused.


How satisfied are organizations with their current ticketing system?
Overall, organizations are satisfied with their current ticketing system and its features. As we segment the analysis by budget level, discipline, and region, we have begun to assess if there are differences between segments in usage and satisfaction rates. (Hint - there are!)


Next Steps
Moving forward, the survey analysis team is considering several questions to identify differences in perspectives about the use, satisfaction, and importance of features of ticketing software systems. Comparisons by discipline, budget level, and region will identify whether divisional trends exist, estimate why trends may occur, and suggest what findings mean for arts organizations and ticketing software providers. We are also researching overall values, the usage of mobile platforms, and potential relationships between different variables.
Please click here to sign up for email alerts specifically relating to the National Ticket Survey.